Organizational Leaders
This guide provides instructions on how to use Soundcheck and is aimed at higher-level users like project managers and organizational leaders. It offers an overview covering the basics of using the Soundcheck Tech-Health Summary tab as well as the use of the Summary tab's filters, such as searching for specific metrics and trends.
Whether you're a team leader seeking to see how your team's technical health is holding up or an organization leader looking to assess a specific technical health objective, this guide will equip you with the necessary knowledge get the Soundcheck metrics you need quickly and easily.
The Tech-Health Page: An Overview
The Tech-Health page provides a high-level overview of the technical health of your organization. It's a great place to start if you're looking to get a quick overview of your organization's check and track pass and fail rates, as well as the pass and fail rates of specific systems, teams, and more.
The Tech-Health page is accessed by clicking the Tech-Health tab after navigating to Soundcheck:
The Tech-Health page contains six sub-tabs, but we'll focus on the Summary tab in this guide.
The Summary tab provides a one-stop-shop for getting a high-level overview of your organization's technical health while providing drill-down capabilities to get to more granular data.
Summary Tab
The summary tab contains four charts that provide a high-level overview of your organization's tech health, as well as a set of filters that allow you to quickly customize the data displayed in the charts. The filters are described in detail in the Filters section.
Let's look at each chart to get an idea of what they show and their purpose.
Check Pass Rate
The Check Pass Rate chart shows the passing percentage of all checks in your organization against all entities. Unfiltered, it is the aggregation of all of your Soundcheck's most recent data.
The chart comprises two views, a snapshot view and a trend view. The snapshot view shows the latest pass rate, while the trend view shows the pass rate over time:
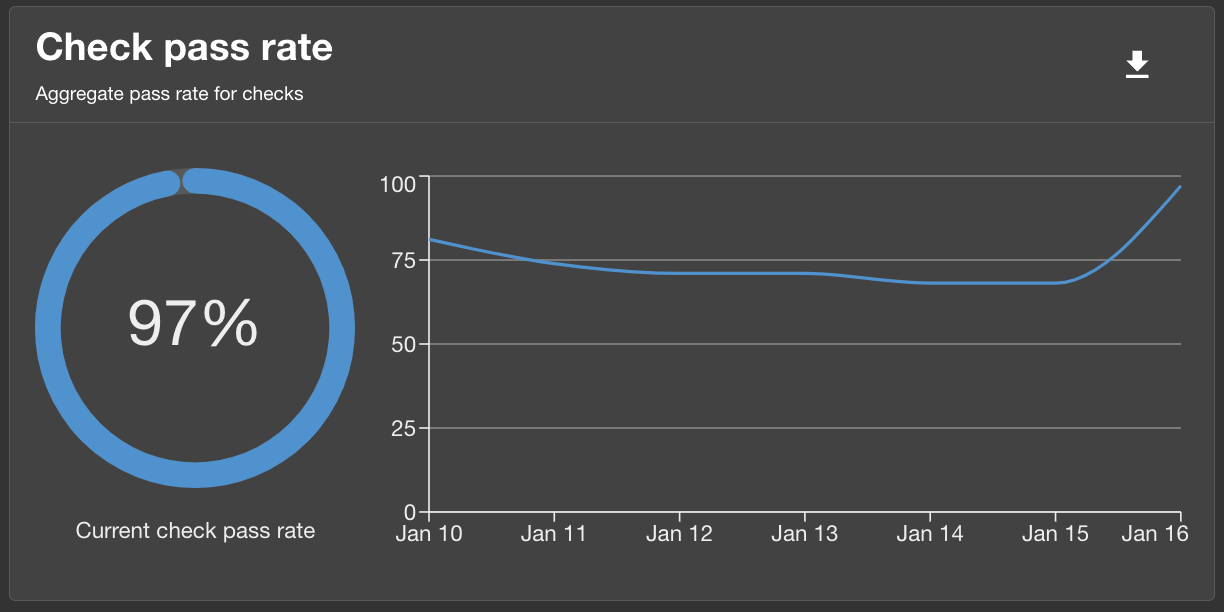
In the image above, the snapshot view shows that the latest pass rate is 97%, while the trend view shows the pass rate as it has changed over the last seven days (the timeline is adjustable, more on that in the filters section).
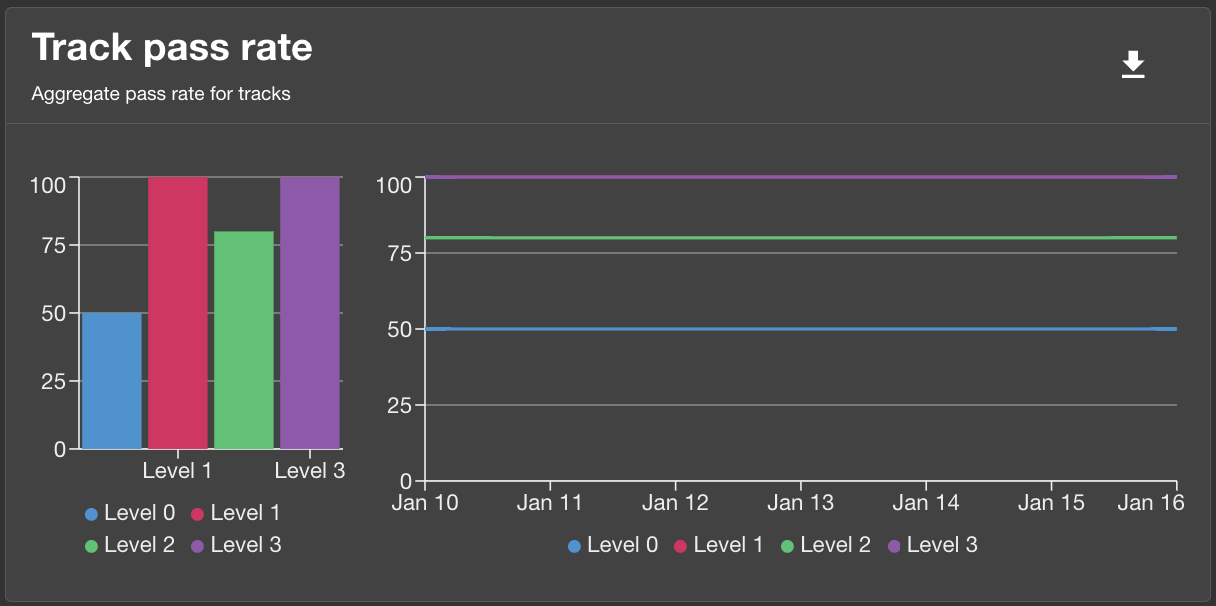
Track Pass Rate
Like the Check Pass Rate chart, the unfiltered Track Pass Rate chart shows the passing percentage of all tracks against all entities in your organization, broken down by track level, and shows both a snapshot view on the left and a trend view on the right:
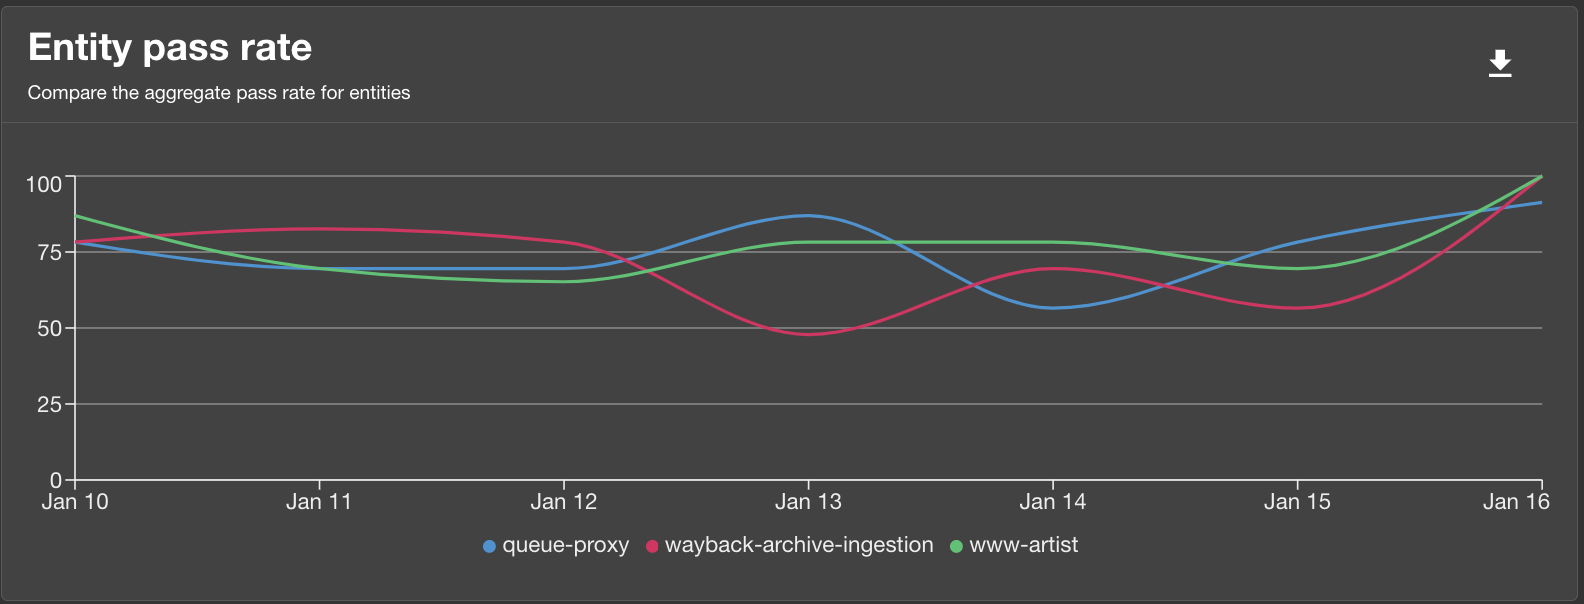
Entity Pass Rate
The unfiltered Entity Pass Rate chart shows the passing percentage trend of the top 5 entities in your organization (note that the test data in the sample image below contains only three entities):
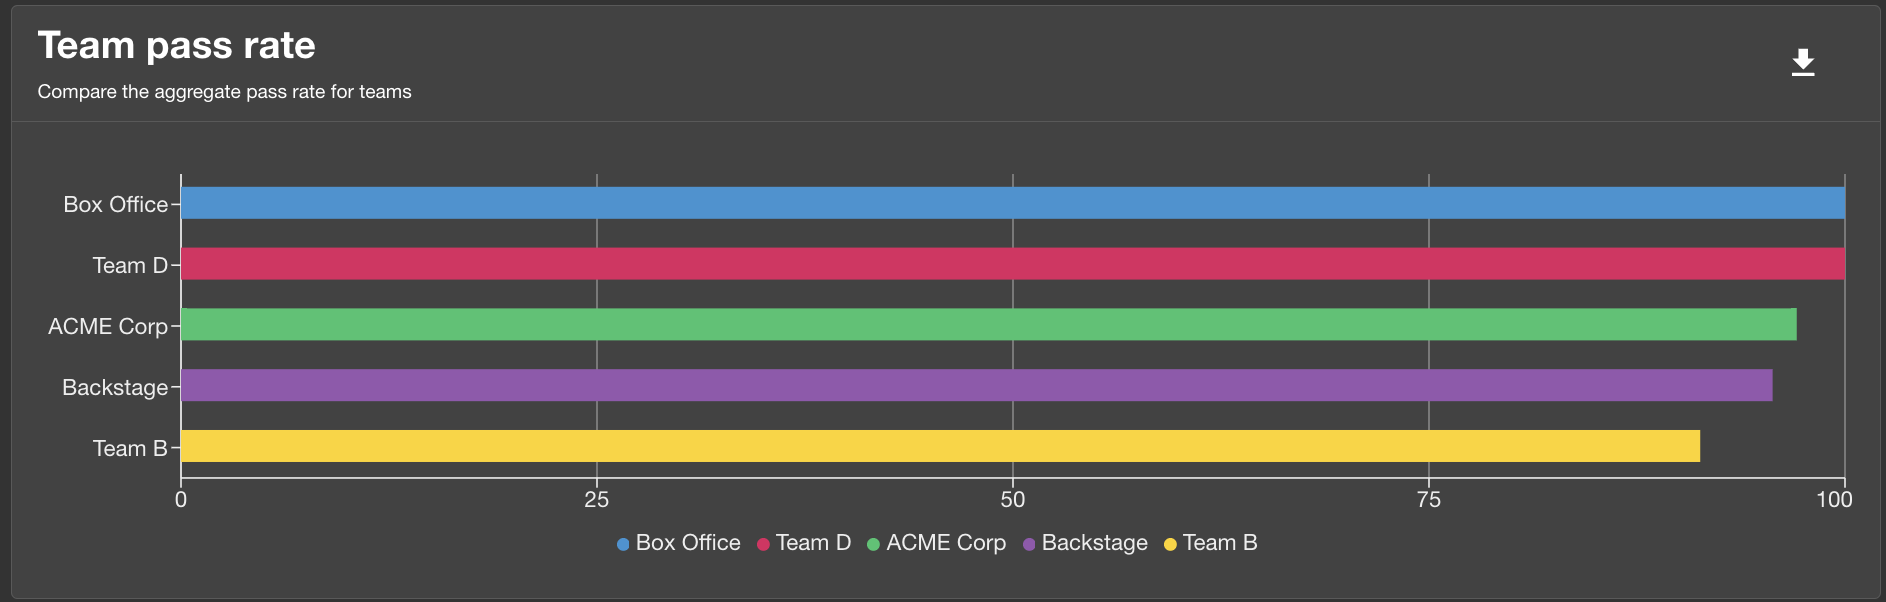
Team Pass Rate
Finally, the unfiltered Team Pass Rate chart shows the latest passing percentage of up to five teams of which the logged-in user is a member:
Filtering Data
So far, we've covered the Summary tab and its four charts with their default behavior, which gives a high-level overview of your organization's technical health at a glance. Now, we'll switch focus and show how to drill down into the data to quickly get more granular results. This filtering is the key to getting the data you need and one of the primary use cases of the Summary tab for organizational leaders and managers. Note however that the filters are available on all tabs, and work in the same way.
Let's take a look at the filter section:
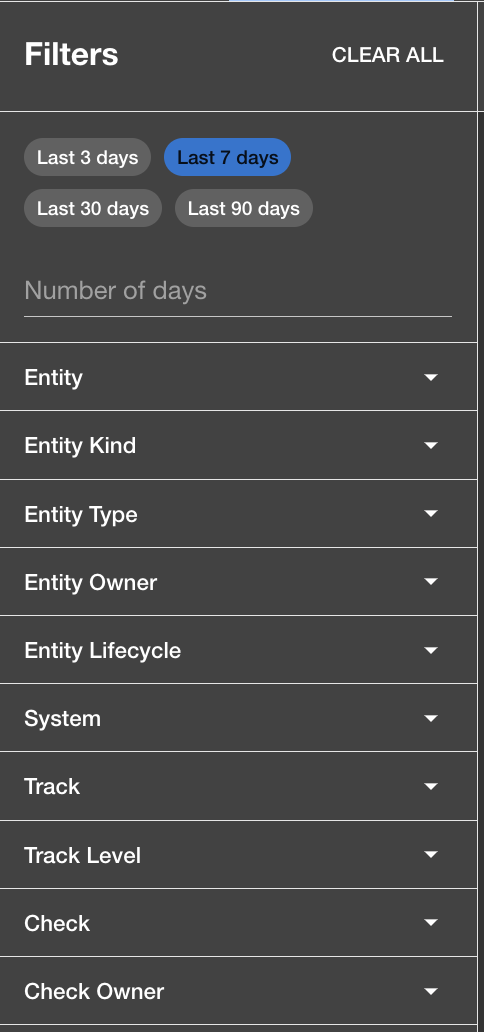
Each of the filters is described briefly below, but first note the following key concepts:
Key Concepts:
- When a filter is changed, Soundcheck data is immediately updated to reflect only that data that passes the filters.
- Different filters are cumulative, each one can be read as "AND". For example a team filter combined with a track filter would be read "I want to see results for this team AND this track".
- Filters support multiple selections. You're not limited to a single team, track, check, etc. You can select as many as you like.
Filters:
- Number of Days: The number of days of data to include in the charts. The default is 7 days.
- Entity: Show data for the chosen entities only.
- Entity Kind: Filter by entity kinds, such as 'Component', 'System', 'API', etc.
- Entity Type: Filter by entity types, such as 'plugin', 'service', 'website', etc.
- Entity Owner: Filter results to only those entities owned by the specified users.
- Entity Lifecycle: Filter by entity lifecycle, such as 'production', 'staging', 'experimental', etc.
- System: Filter by systems, which are compositions of entities.
- Track: Filter by tracks, which are compositions of levels and checks.
- Track Level: Filter by track levels, which are compositions of checks.
- Check: Filter by specific checks.
- Check Owner: Filter by check owners.
Use Cases
Use Case 1: How can I assess the technical health of a specific track?
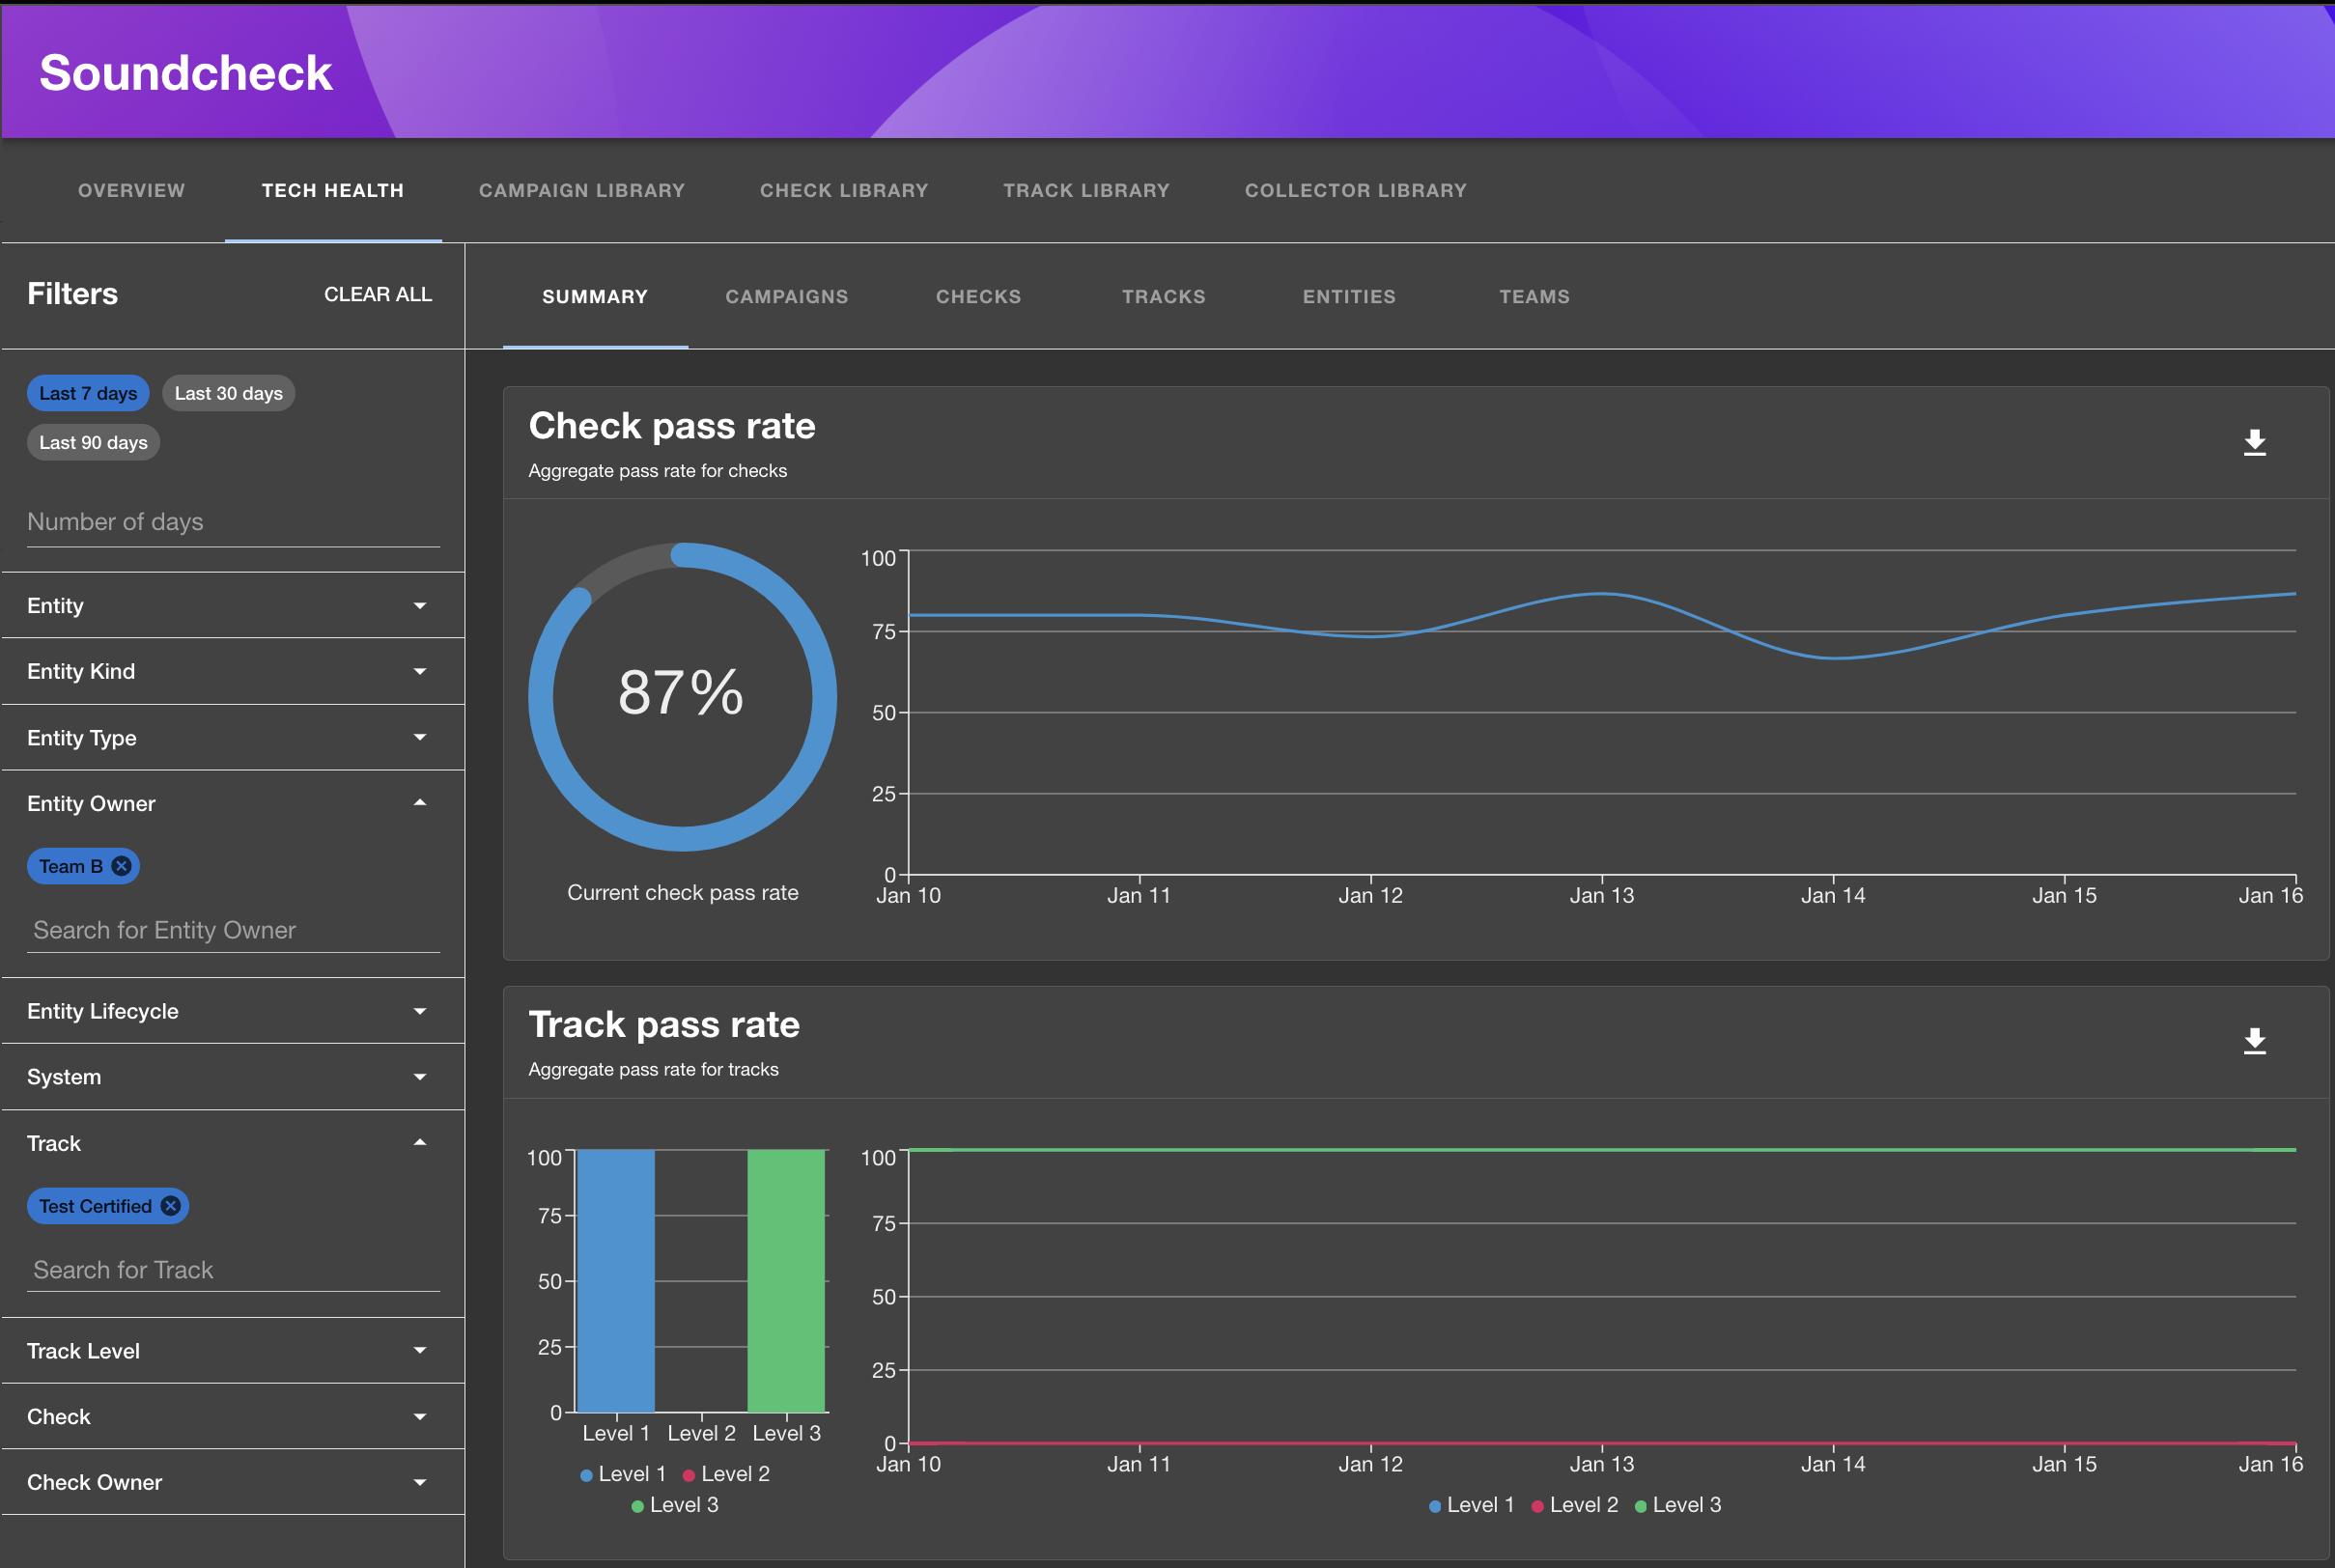
As an organizational leader, you want to see the overall adoption/adherence to a given track. First, select the track you're interested in under the 'Track' filter. The charts will update, showing results filtered to only include checks that are part of the selected track:
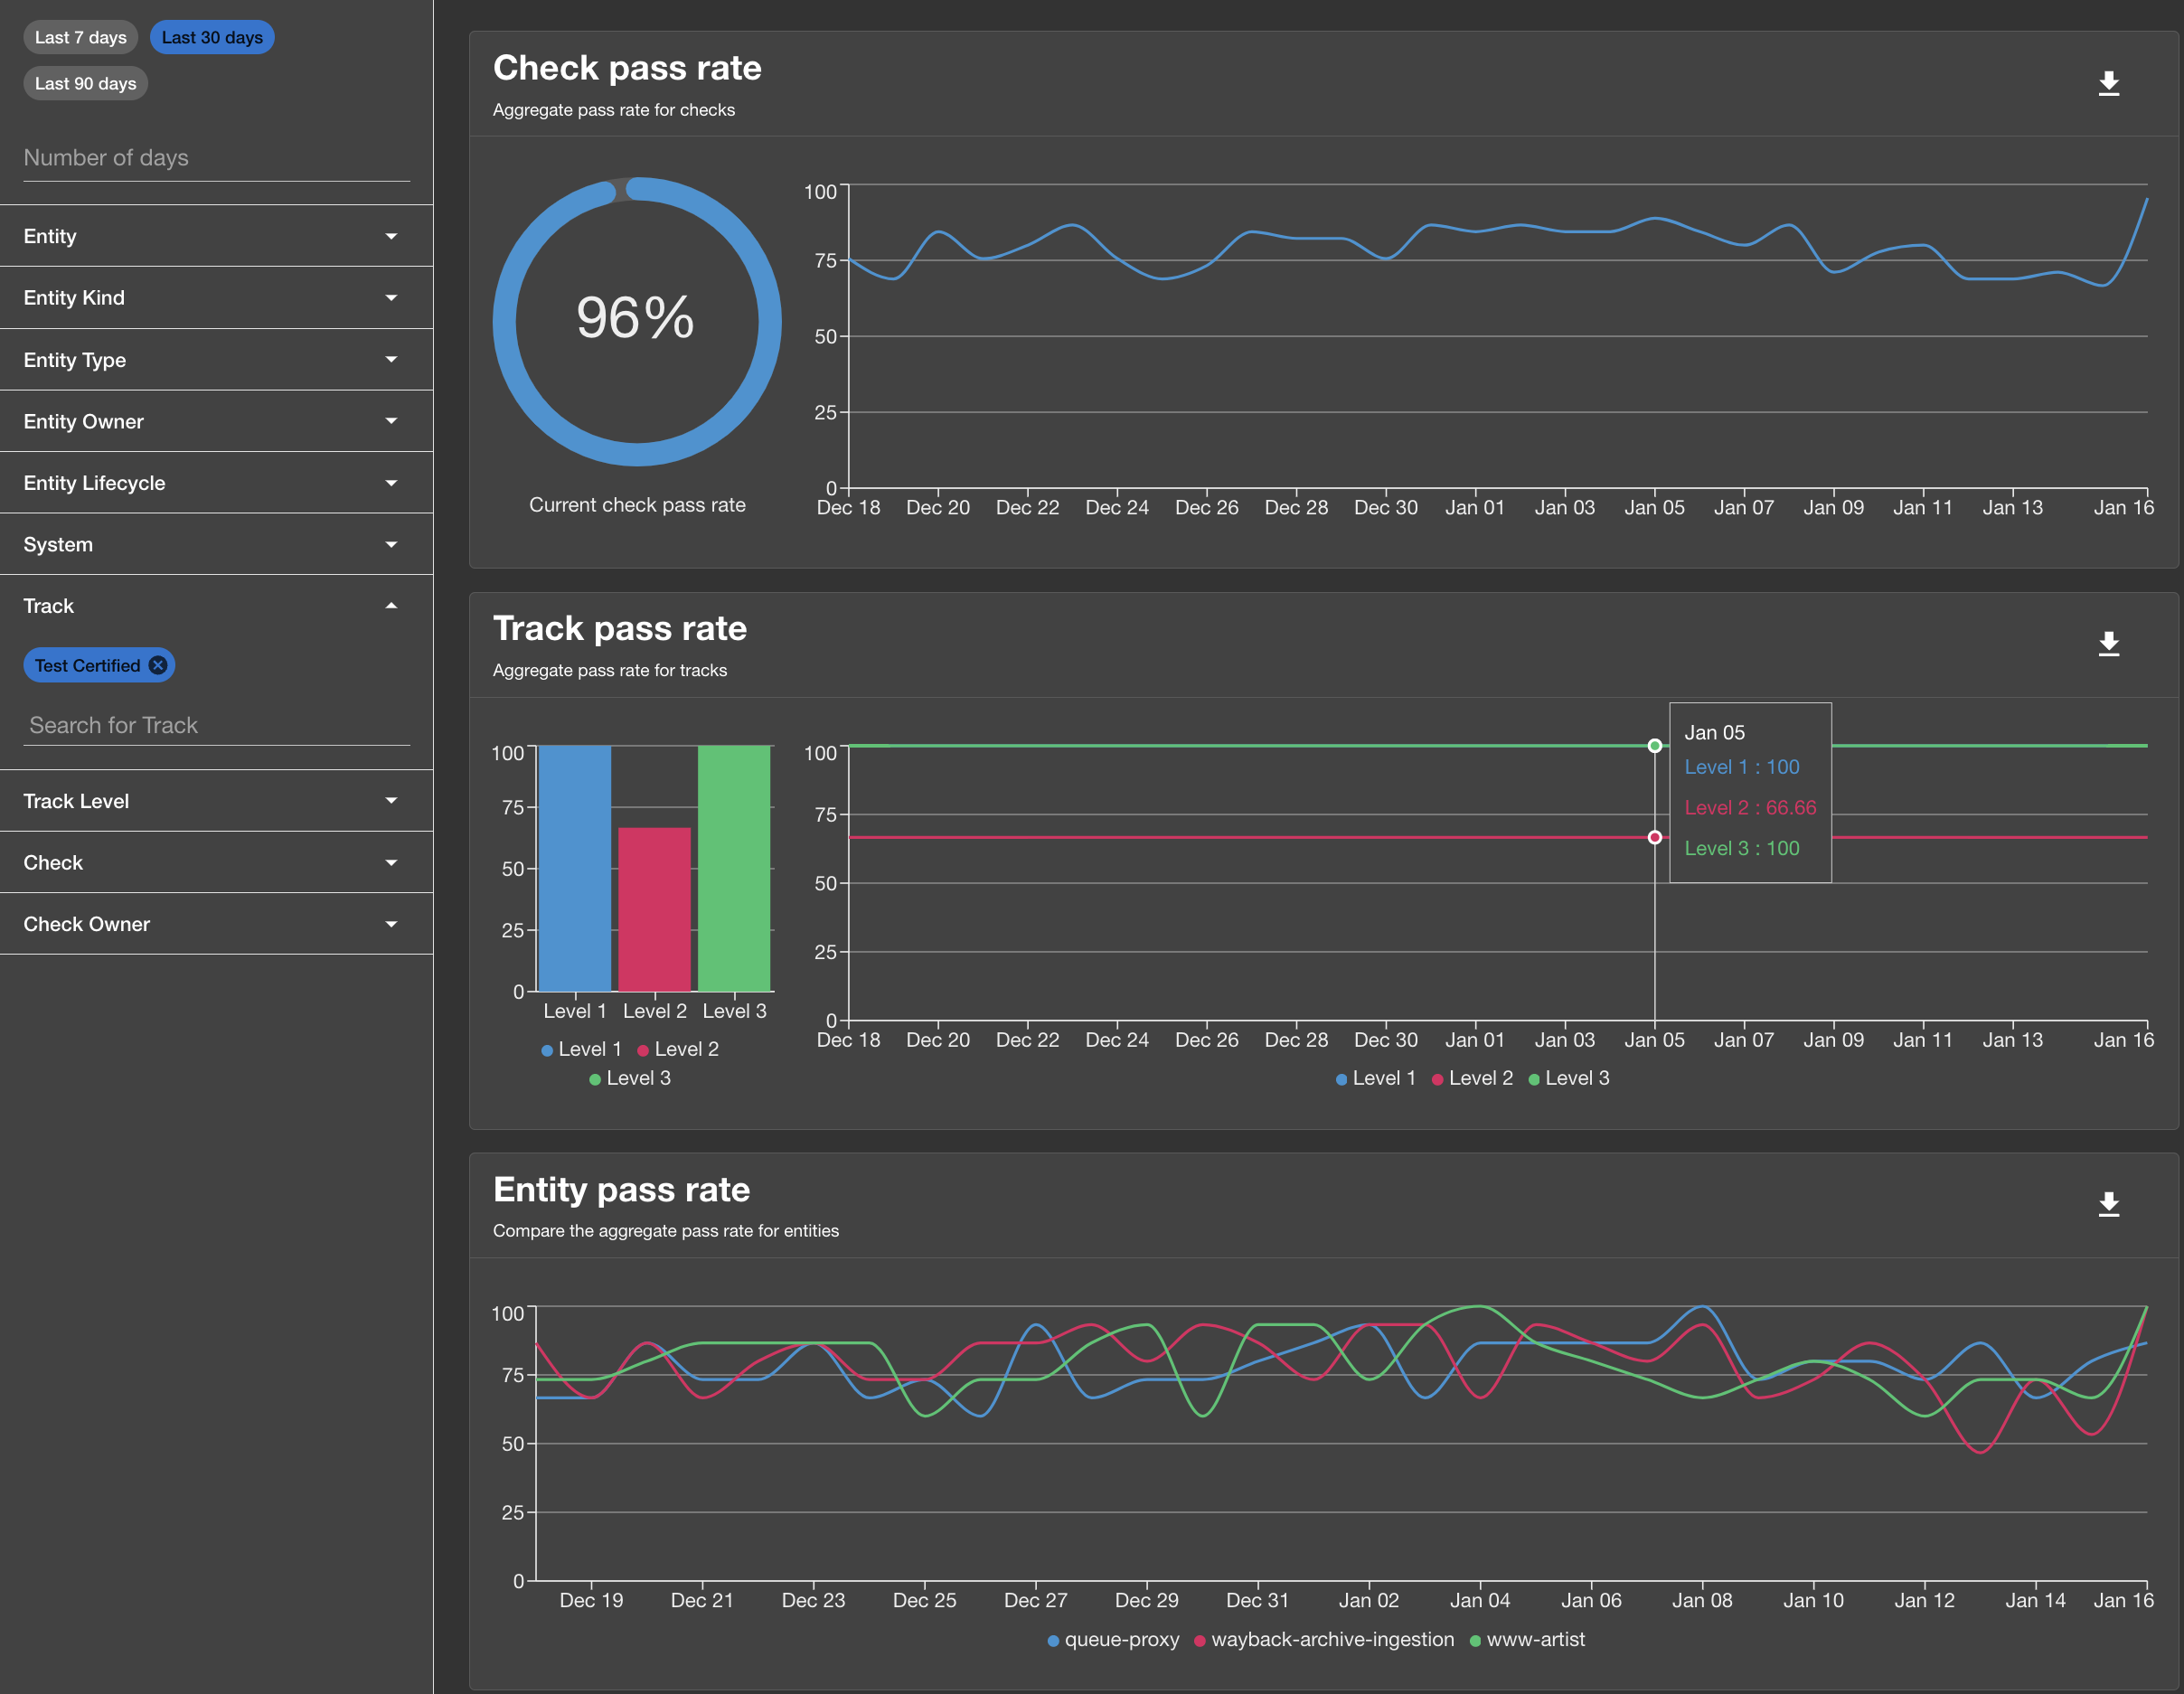
Above, check pass rates, track pass rates, and the entity pass rate charts are all updated to reflect
only the status of the Test Certified track.
Next you may want to see the track details so click on Tracks tab.

Search or scroll to find the track you want to see details of. Remember that the filters you have chosen on the left sidebar still apply.
Once you found the track click on View Detail.
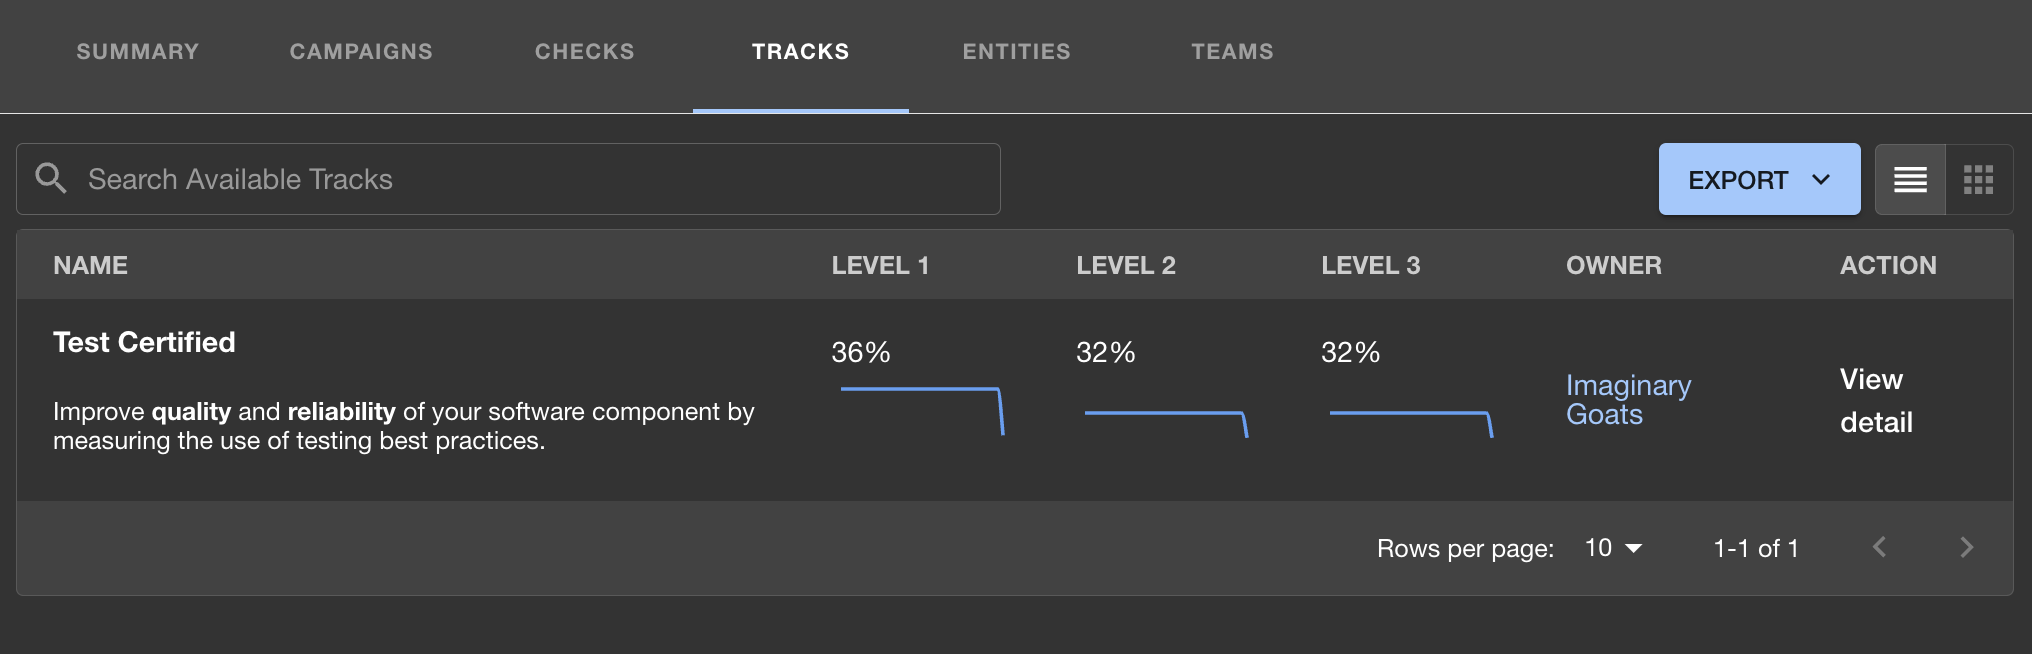
On the top of the Track Details page you will see the passing rate for each level as well as filters that allow you to see data for specific teams/systems/types/lifecycles.
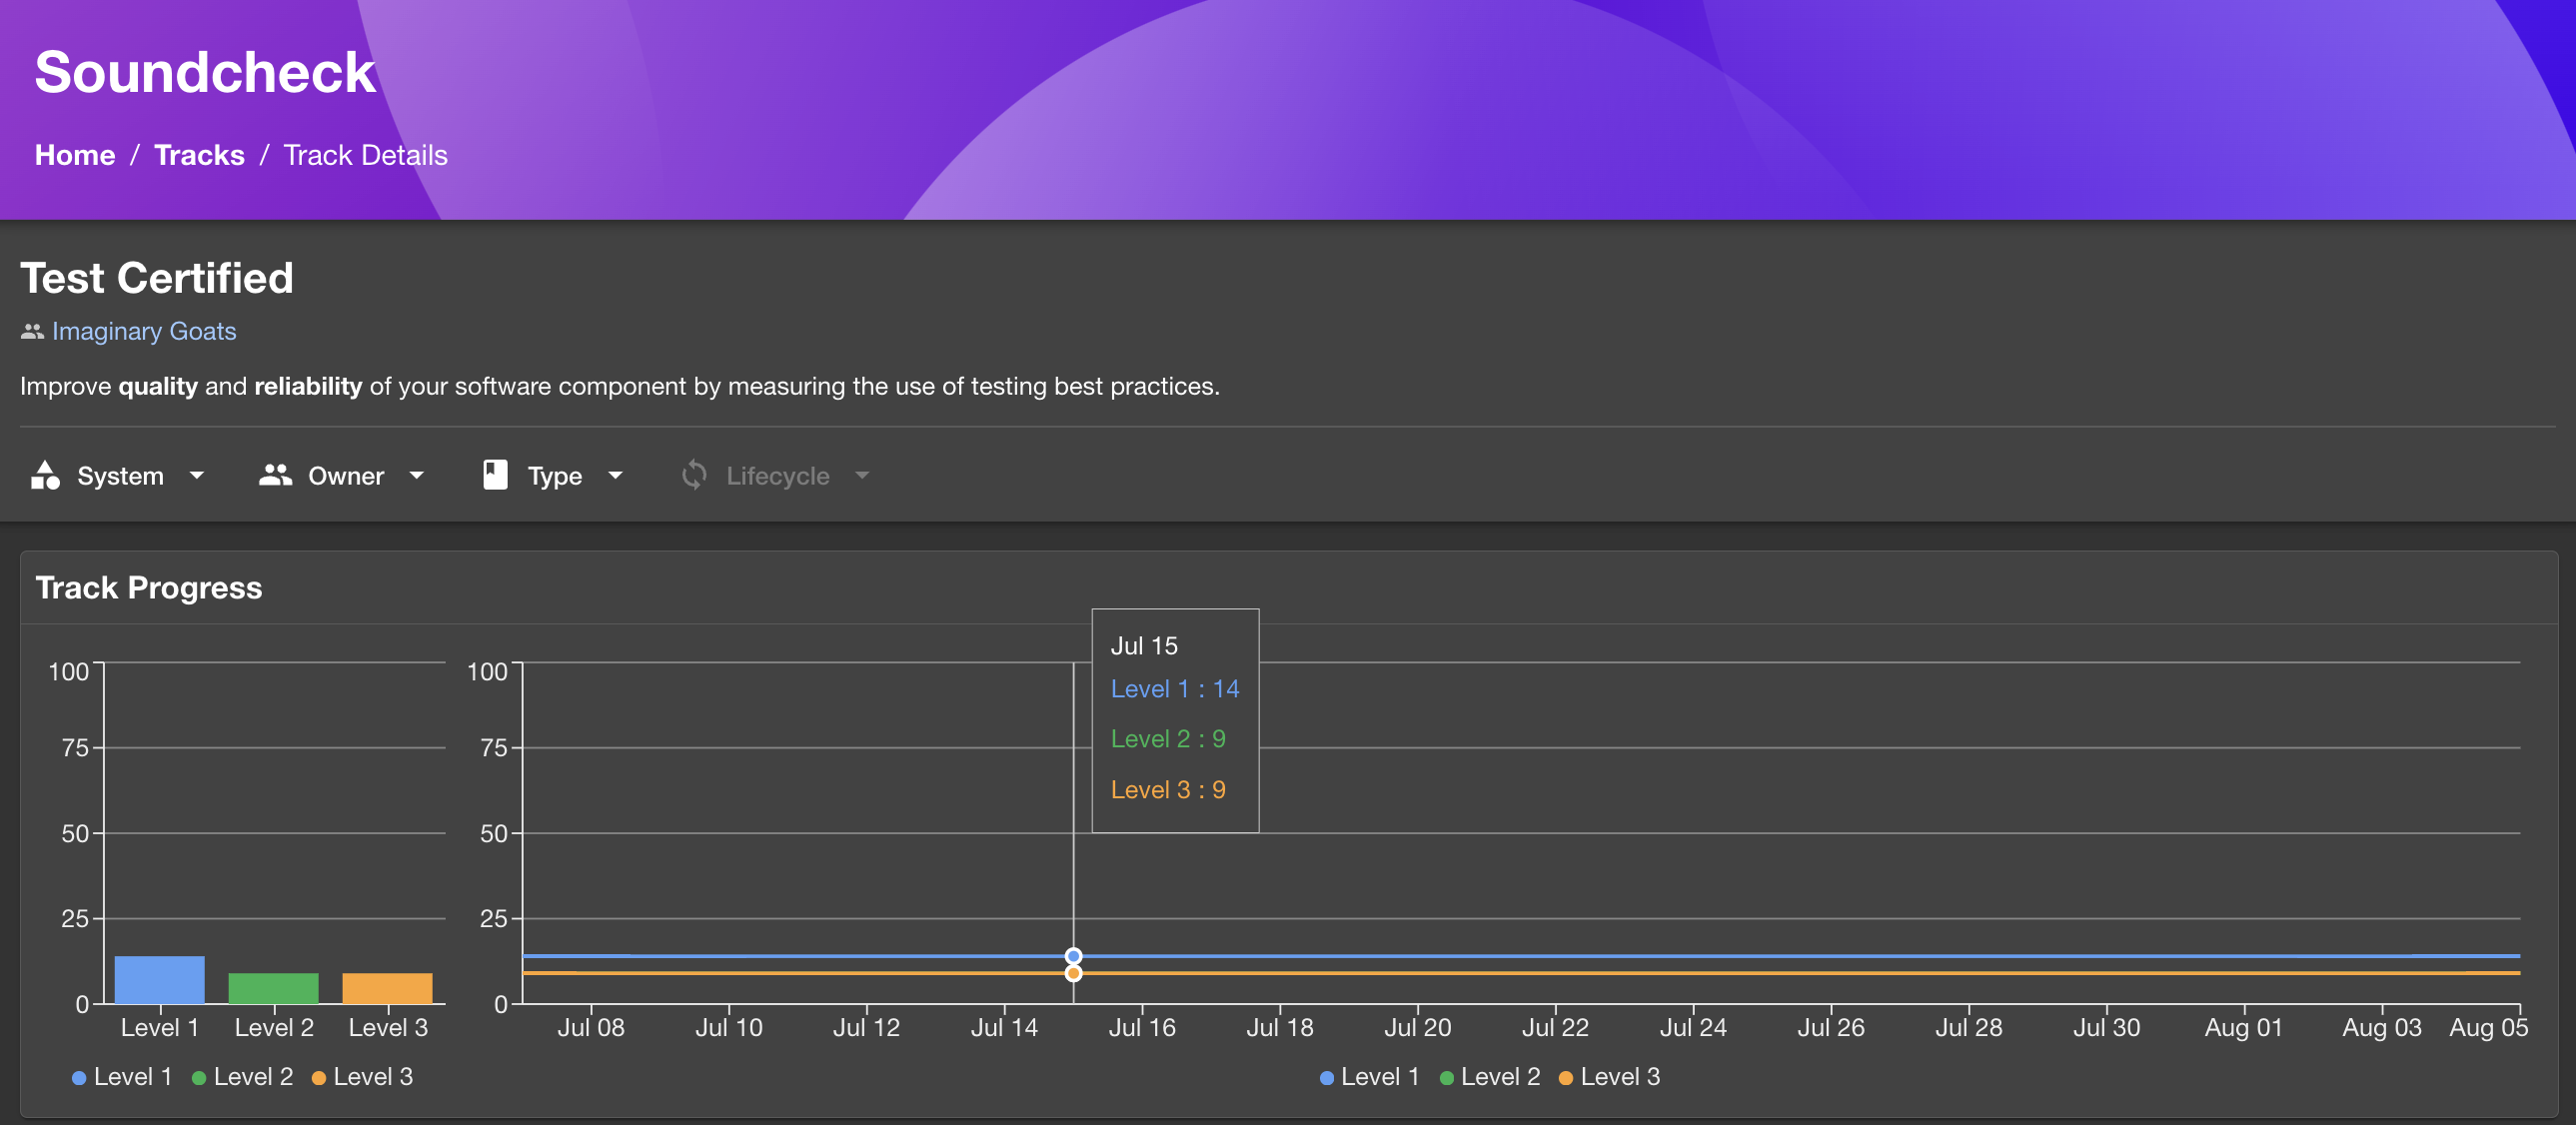
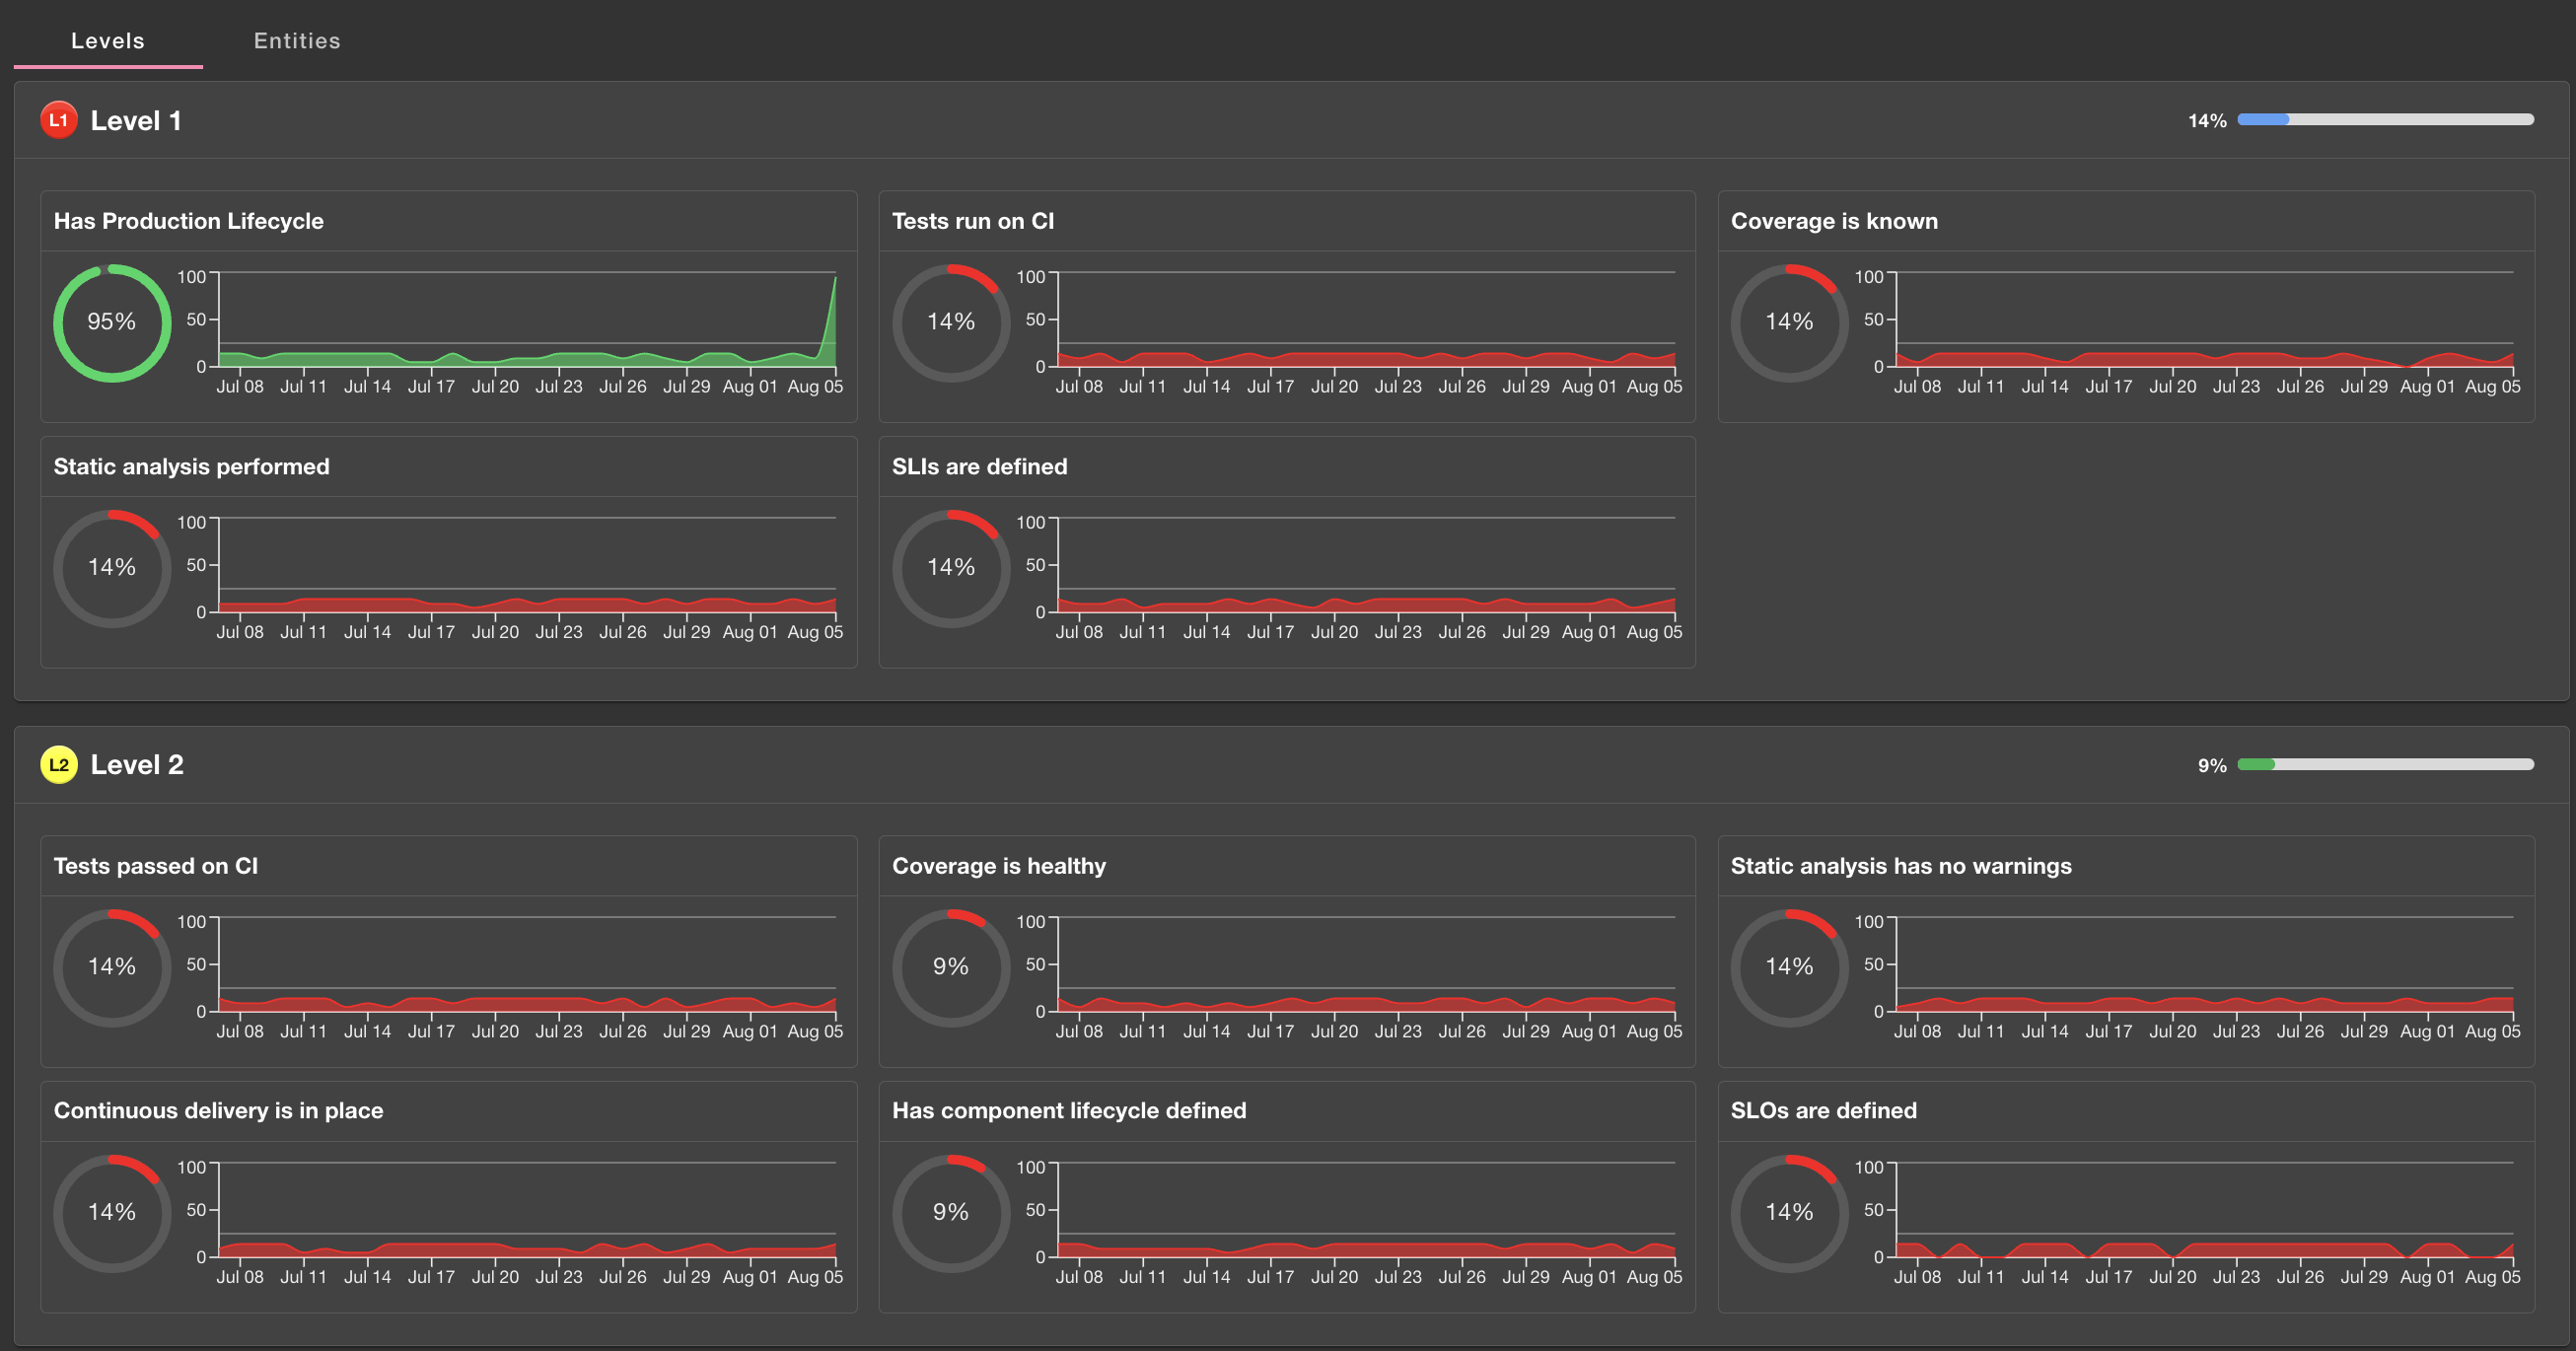
Below you will find a breakdown of each track level where you can see the passing rate of specific checks within these levels.
Use Case 2: How can I assess the technical health of a specific system?
Say you're a project manager, and you want to see how a specific system is doing in terms of a specific technical health objective. You can do this by filtering the data to only include the system in question as well as specifying which track (technical health objective) you want to assess.
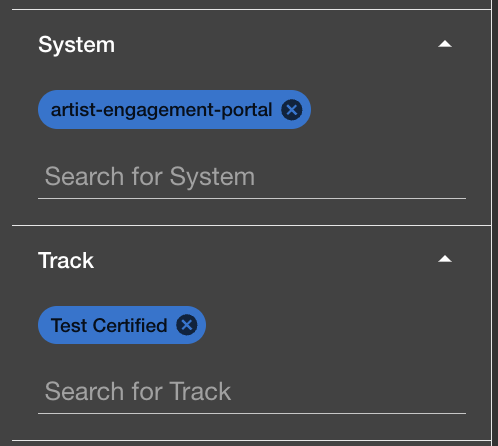
In the test data there is a system, 'artist-engagement-portal', which for demonstration purposes contains only a single entity, but which in practice could comprise tens or hundreds of entities. Let's say you want to see how this system is doing in terms of the 'Test Certified' track. First, you would select the 'artist-engagement-portal' system under the 'System' filter, and then the 'Test Certified' track under the 'Track' filter:
Voilà! The charts are now updated to show only the data for the 'artist-engagement-portal' system, and only for the 'Test Certified' track:
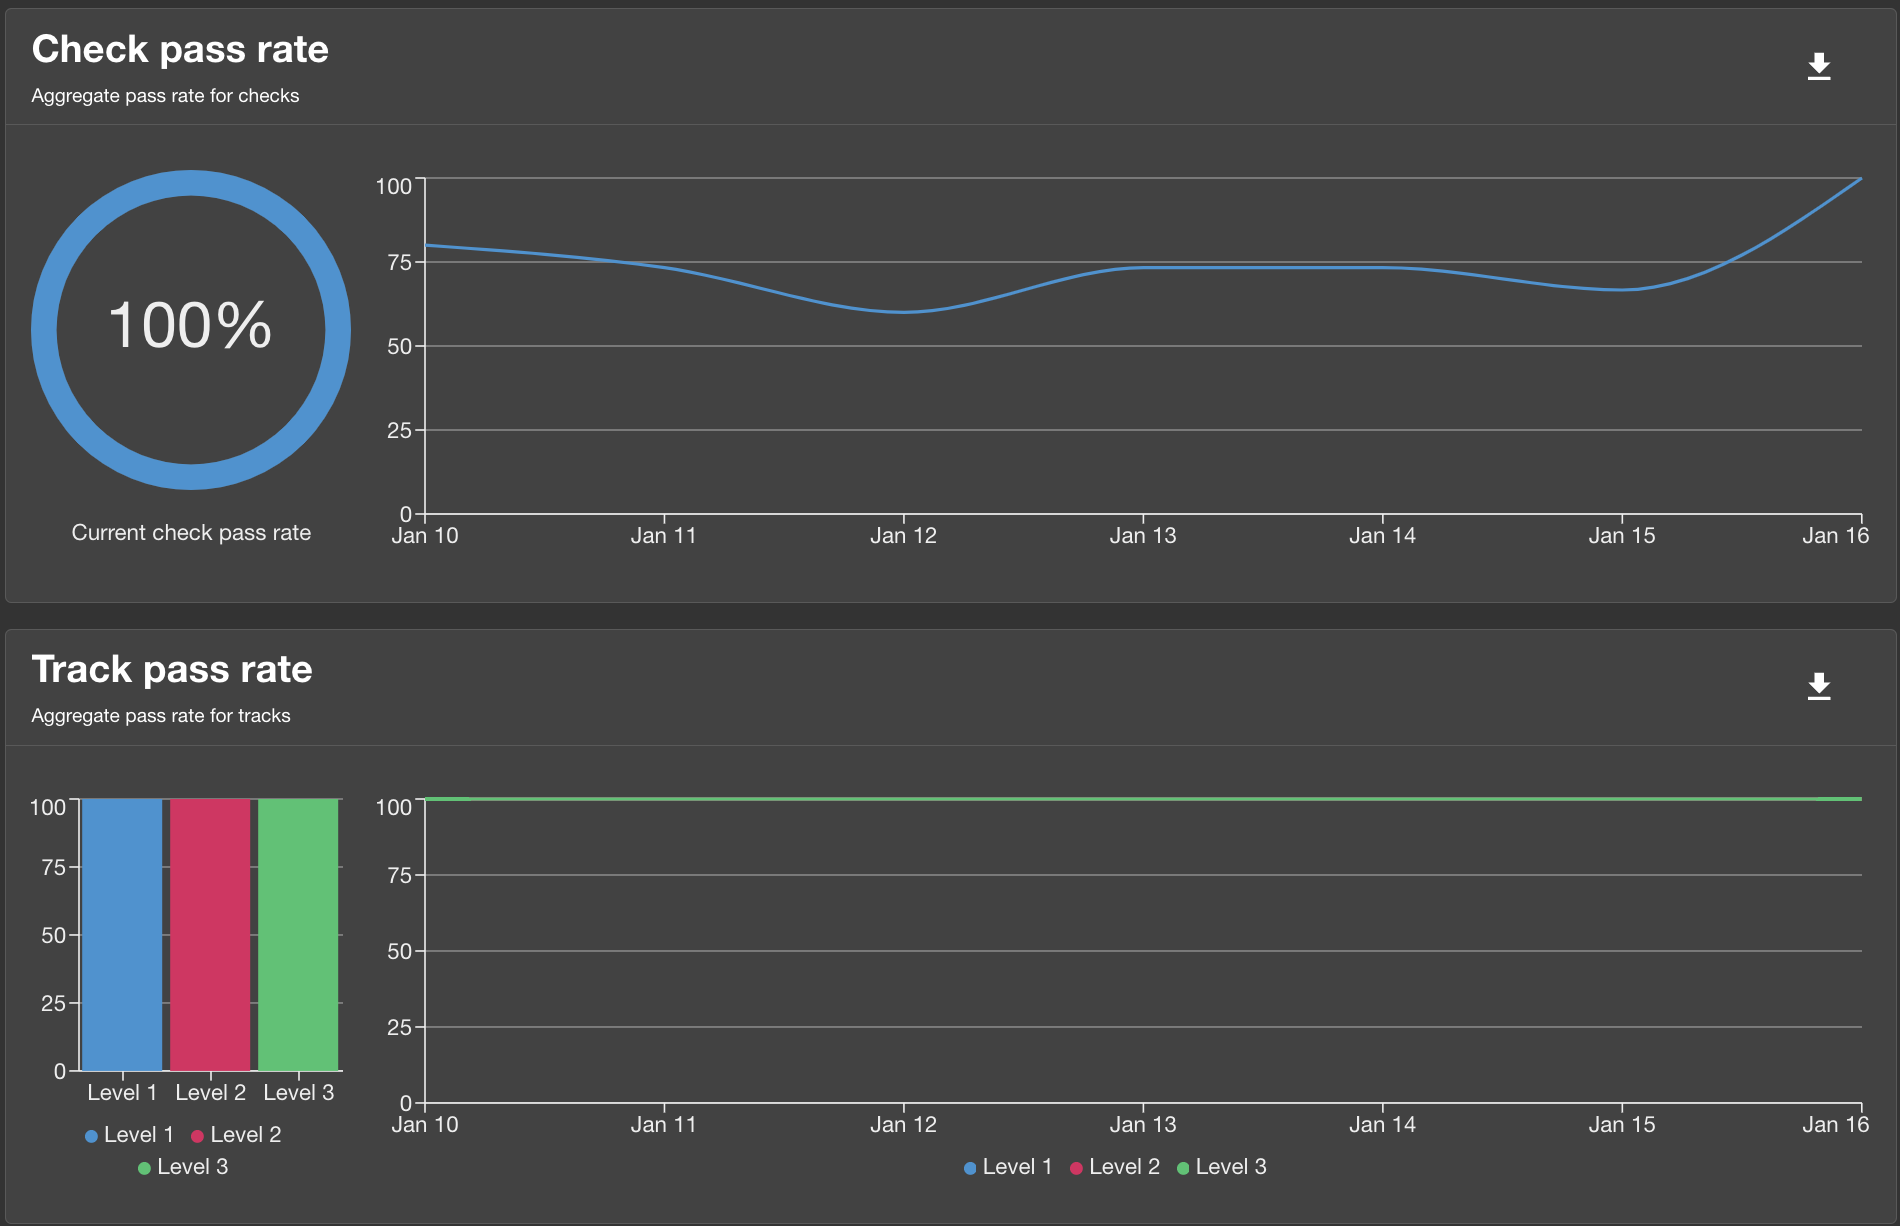
With the filter specified, what you'll now see is the total check pass rate and track pass rates, but only for those entities that belong to the 'artist-engagement-portal' system, and only those checks that are part of the 'Test Certified' track.
The artist-engagement-portal system is doing great! It has a 100% pass rate for the 'Test Certified' track.
Use Case 3: How can I assess the technical health of a specific team?
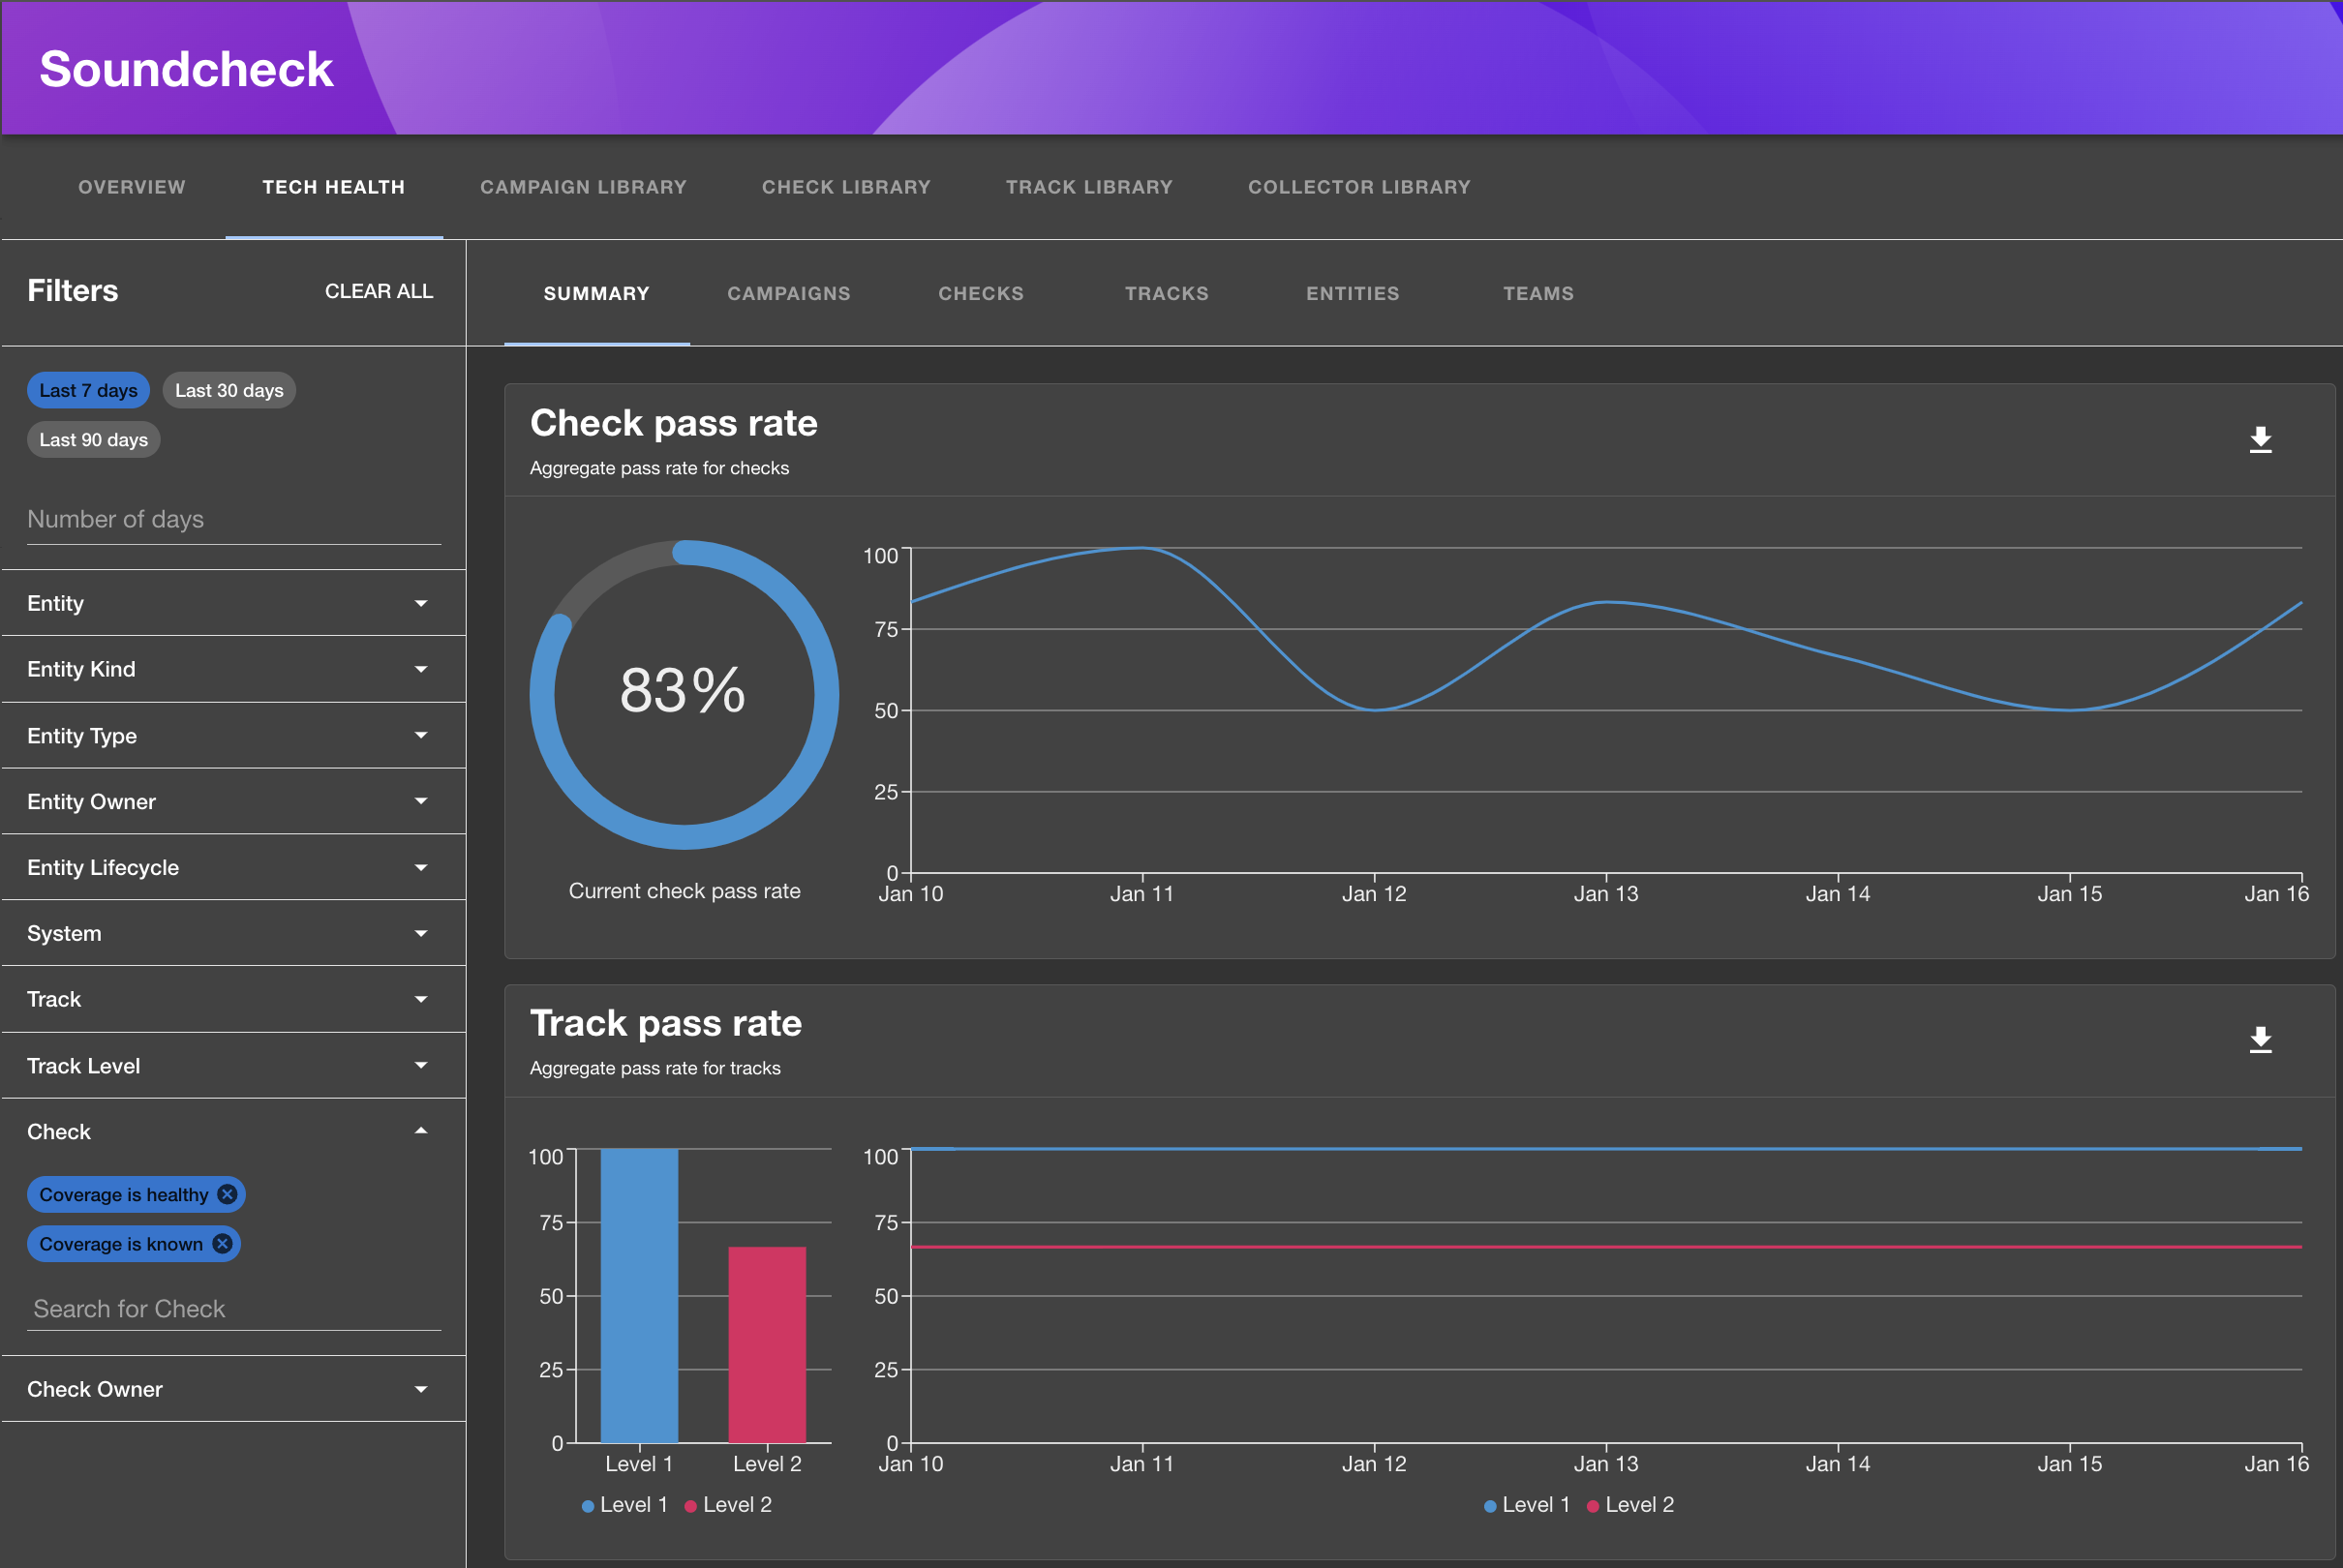
In our next example, let's say you're a team leader, and you want to see how your team is doing in terms of a few targeted tracks. Easy enough, first select your team under the 'Team' filter, and then select the tracks in which you're interested under the 'Track' filter:
Not bad! The data is now filtered to only show checks that apply to entities owned by 'Team-B', and only those checks that are part of the 'Test Certified' track. Clearly there's an issue with checks in level two of the track, but the team is doing great on levels one and three.
Use Case 4: How can I assess the technical health of a specific check?
Finally, say there is a particular set of checks that you're interested in, and you want to see how they're doing across your organization. Select the checks under the 'Check' filter, and the charts will update to show only the pass rate data relevant to those checks. The summary page will show the overall pass rate:
However, let's suppose you want to see the pass rate per check. Switch to the "Checks" tab, and you'll see the pass rate for each check individually:
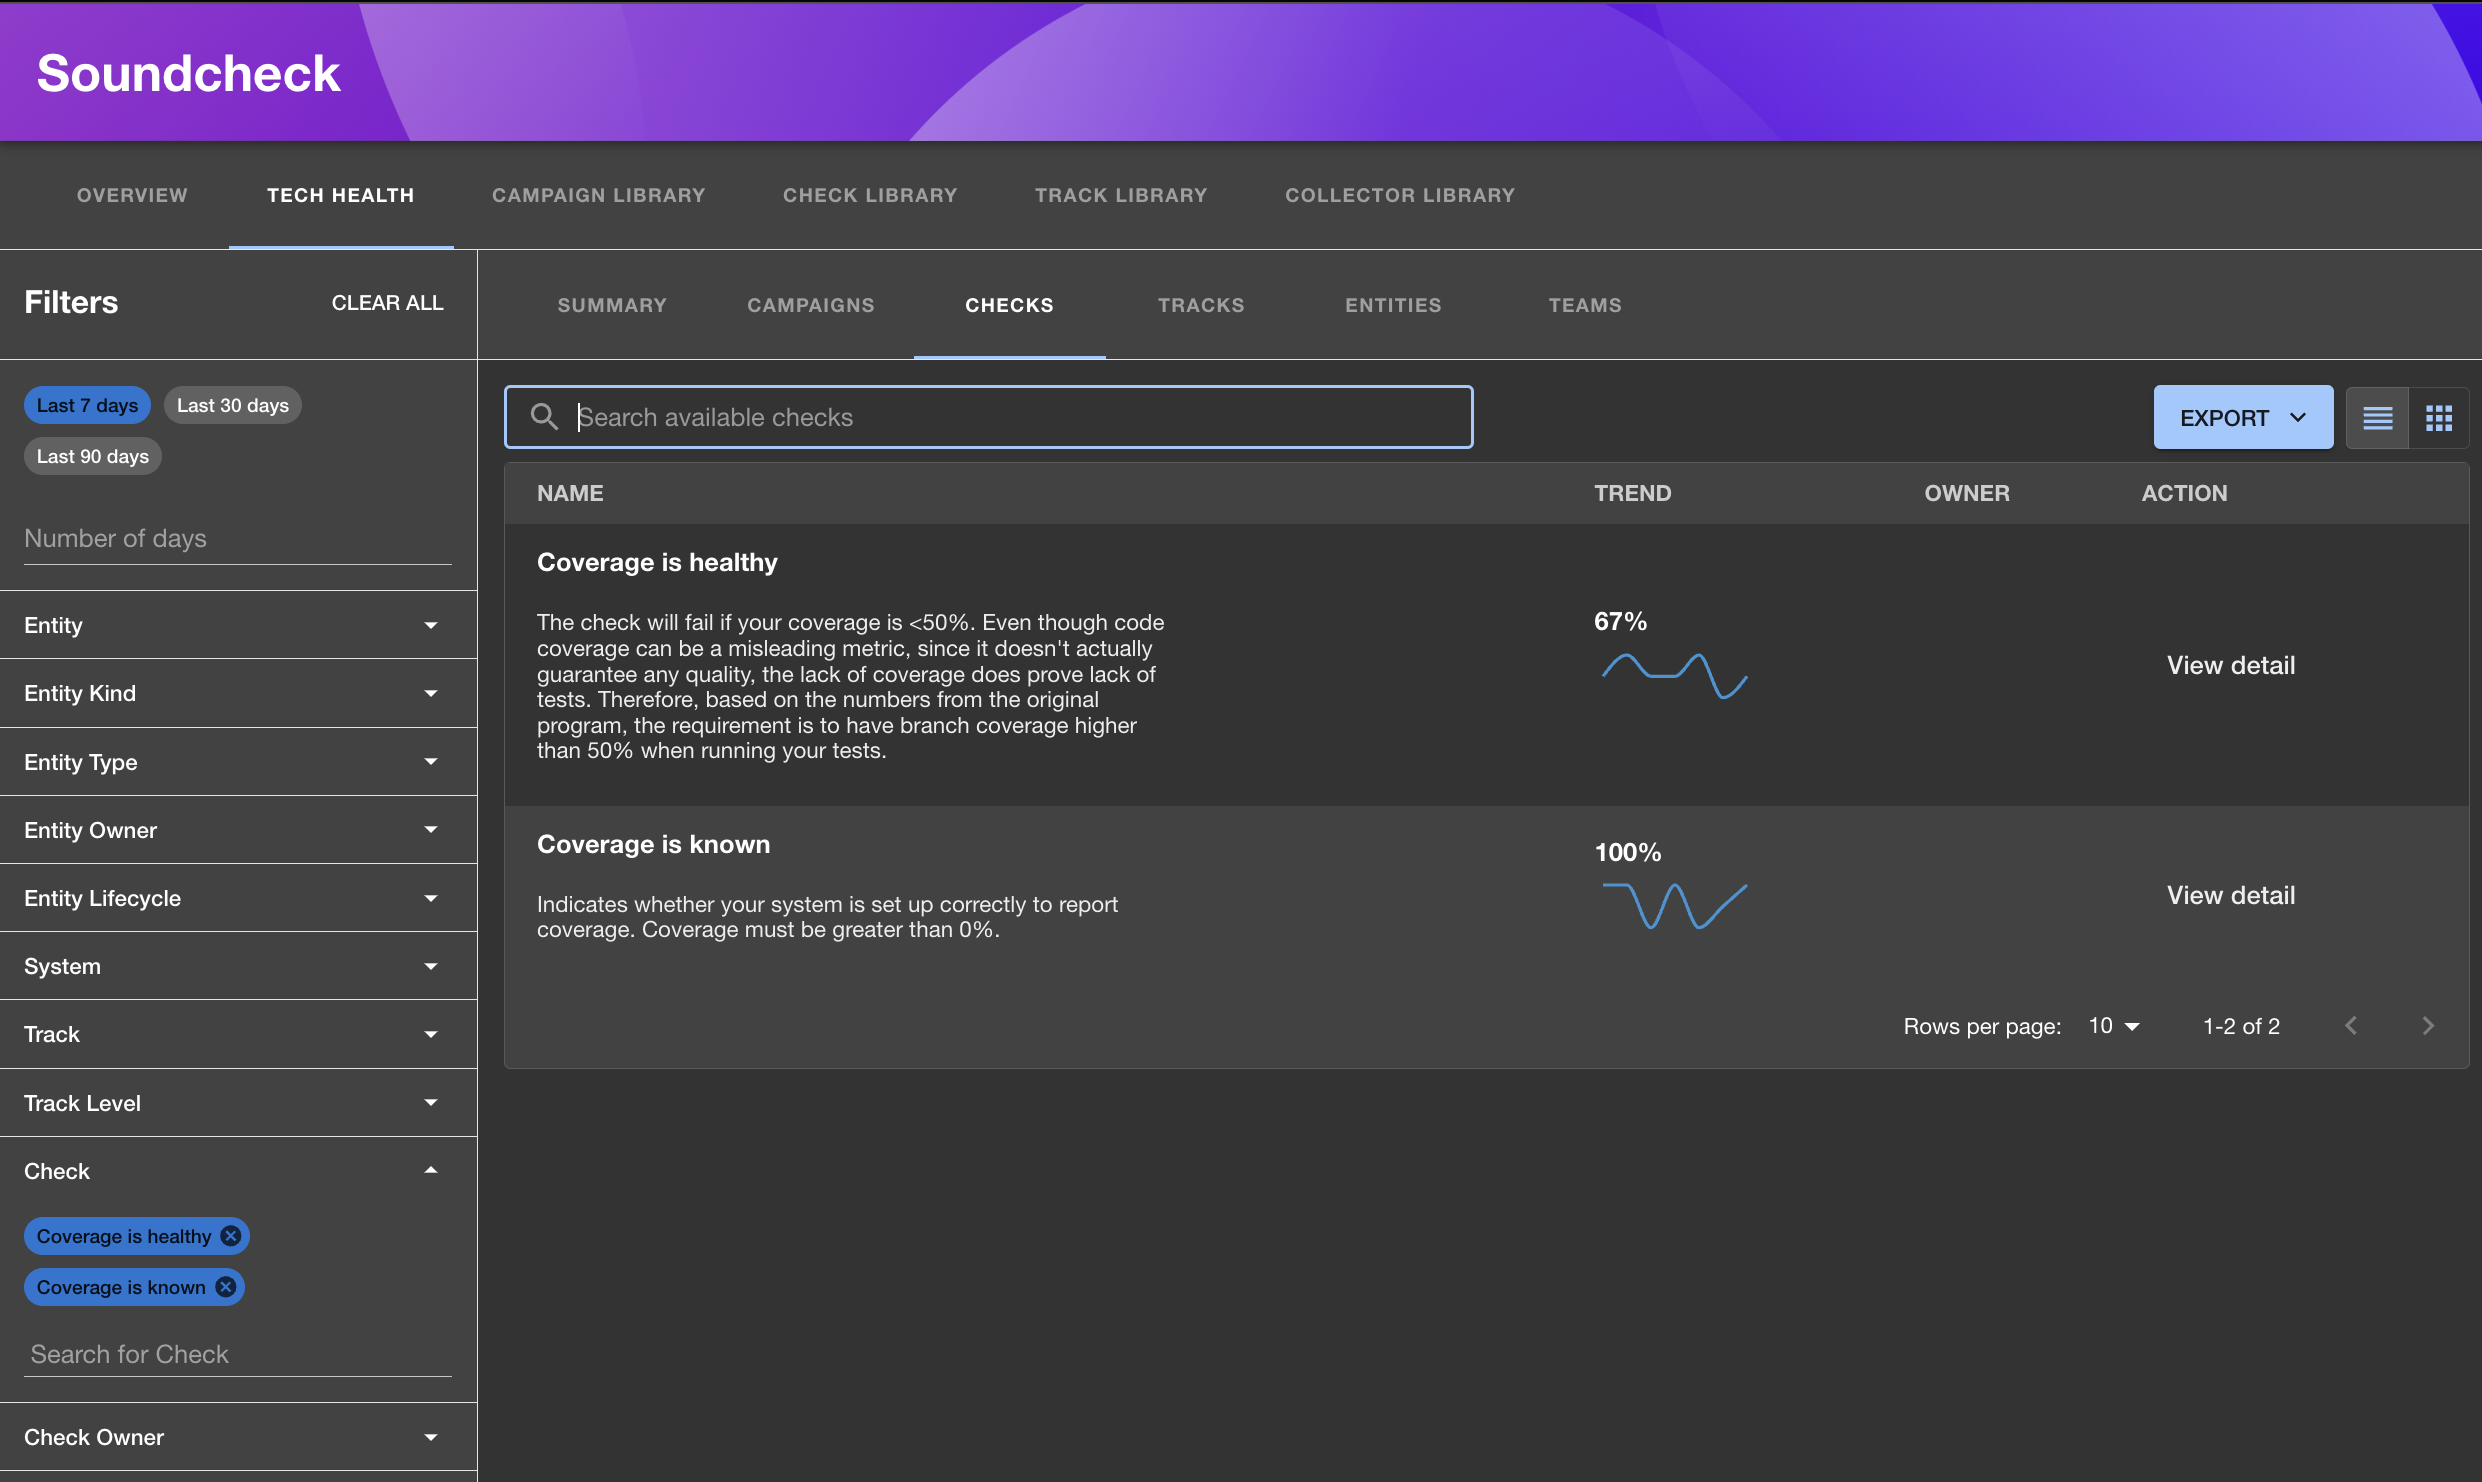
Note that when switching tabs, the filters remained in place and applied to both tabs.
Next you can drill down into the details of a specific check. Click on View Detail next to the check.
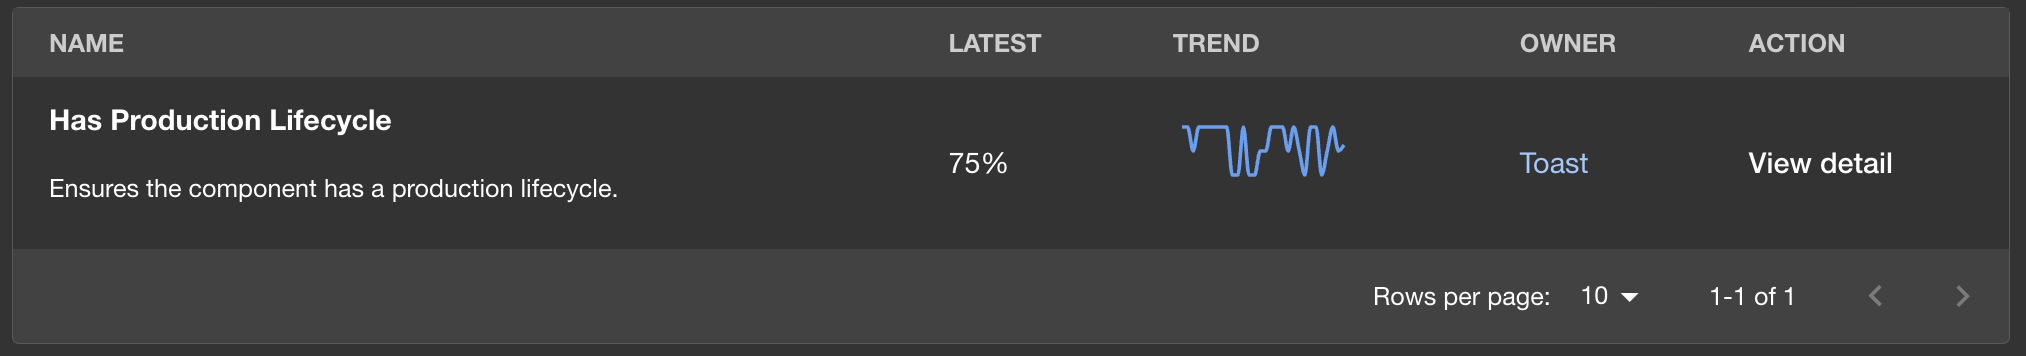
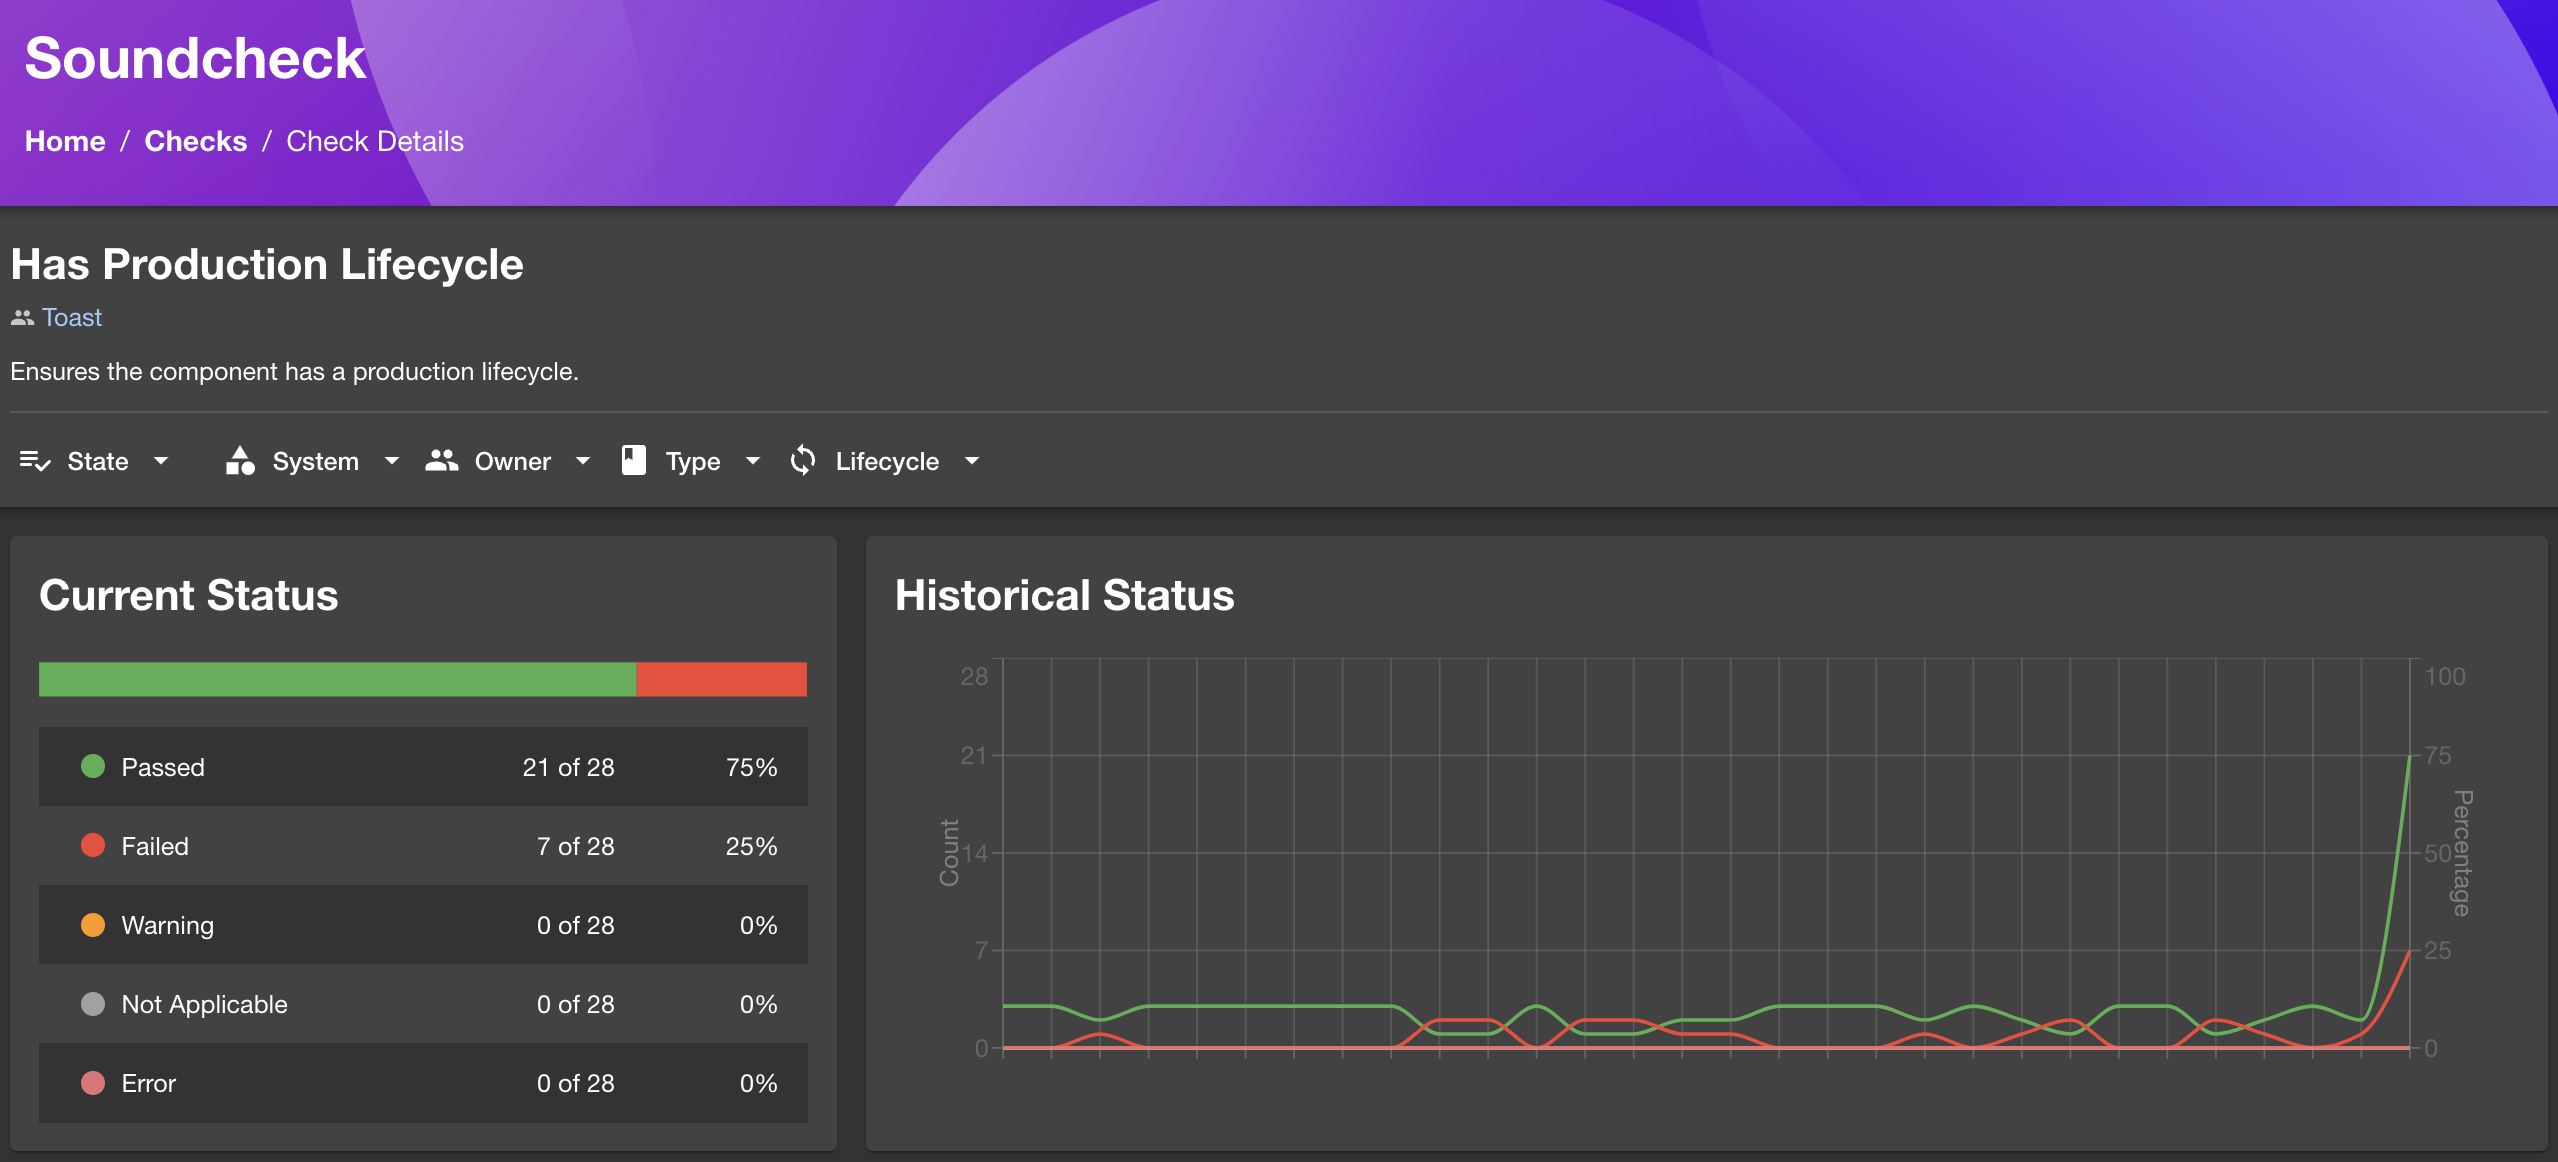
On the Check Details page you will see the Current Status of the check with a detailed breakdown of the status. On the right you can see the history of the pass/fail ratio of the check. You can also use filters on top to see checks data for specific state/system/lifecycle/owner/type.
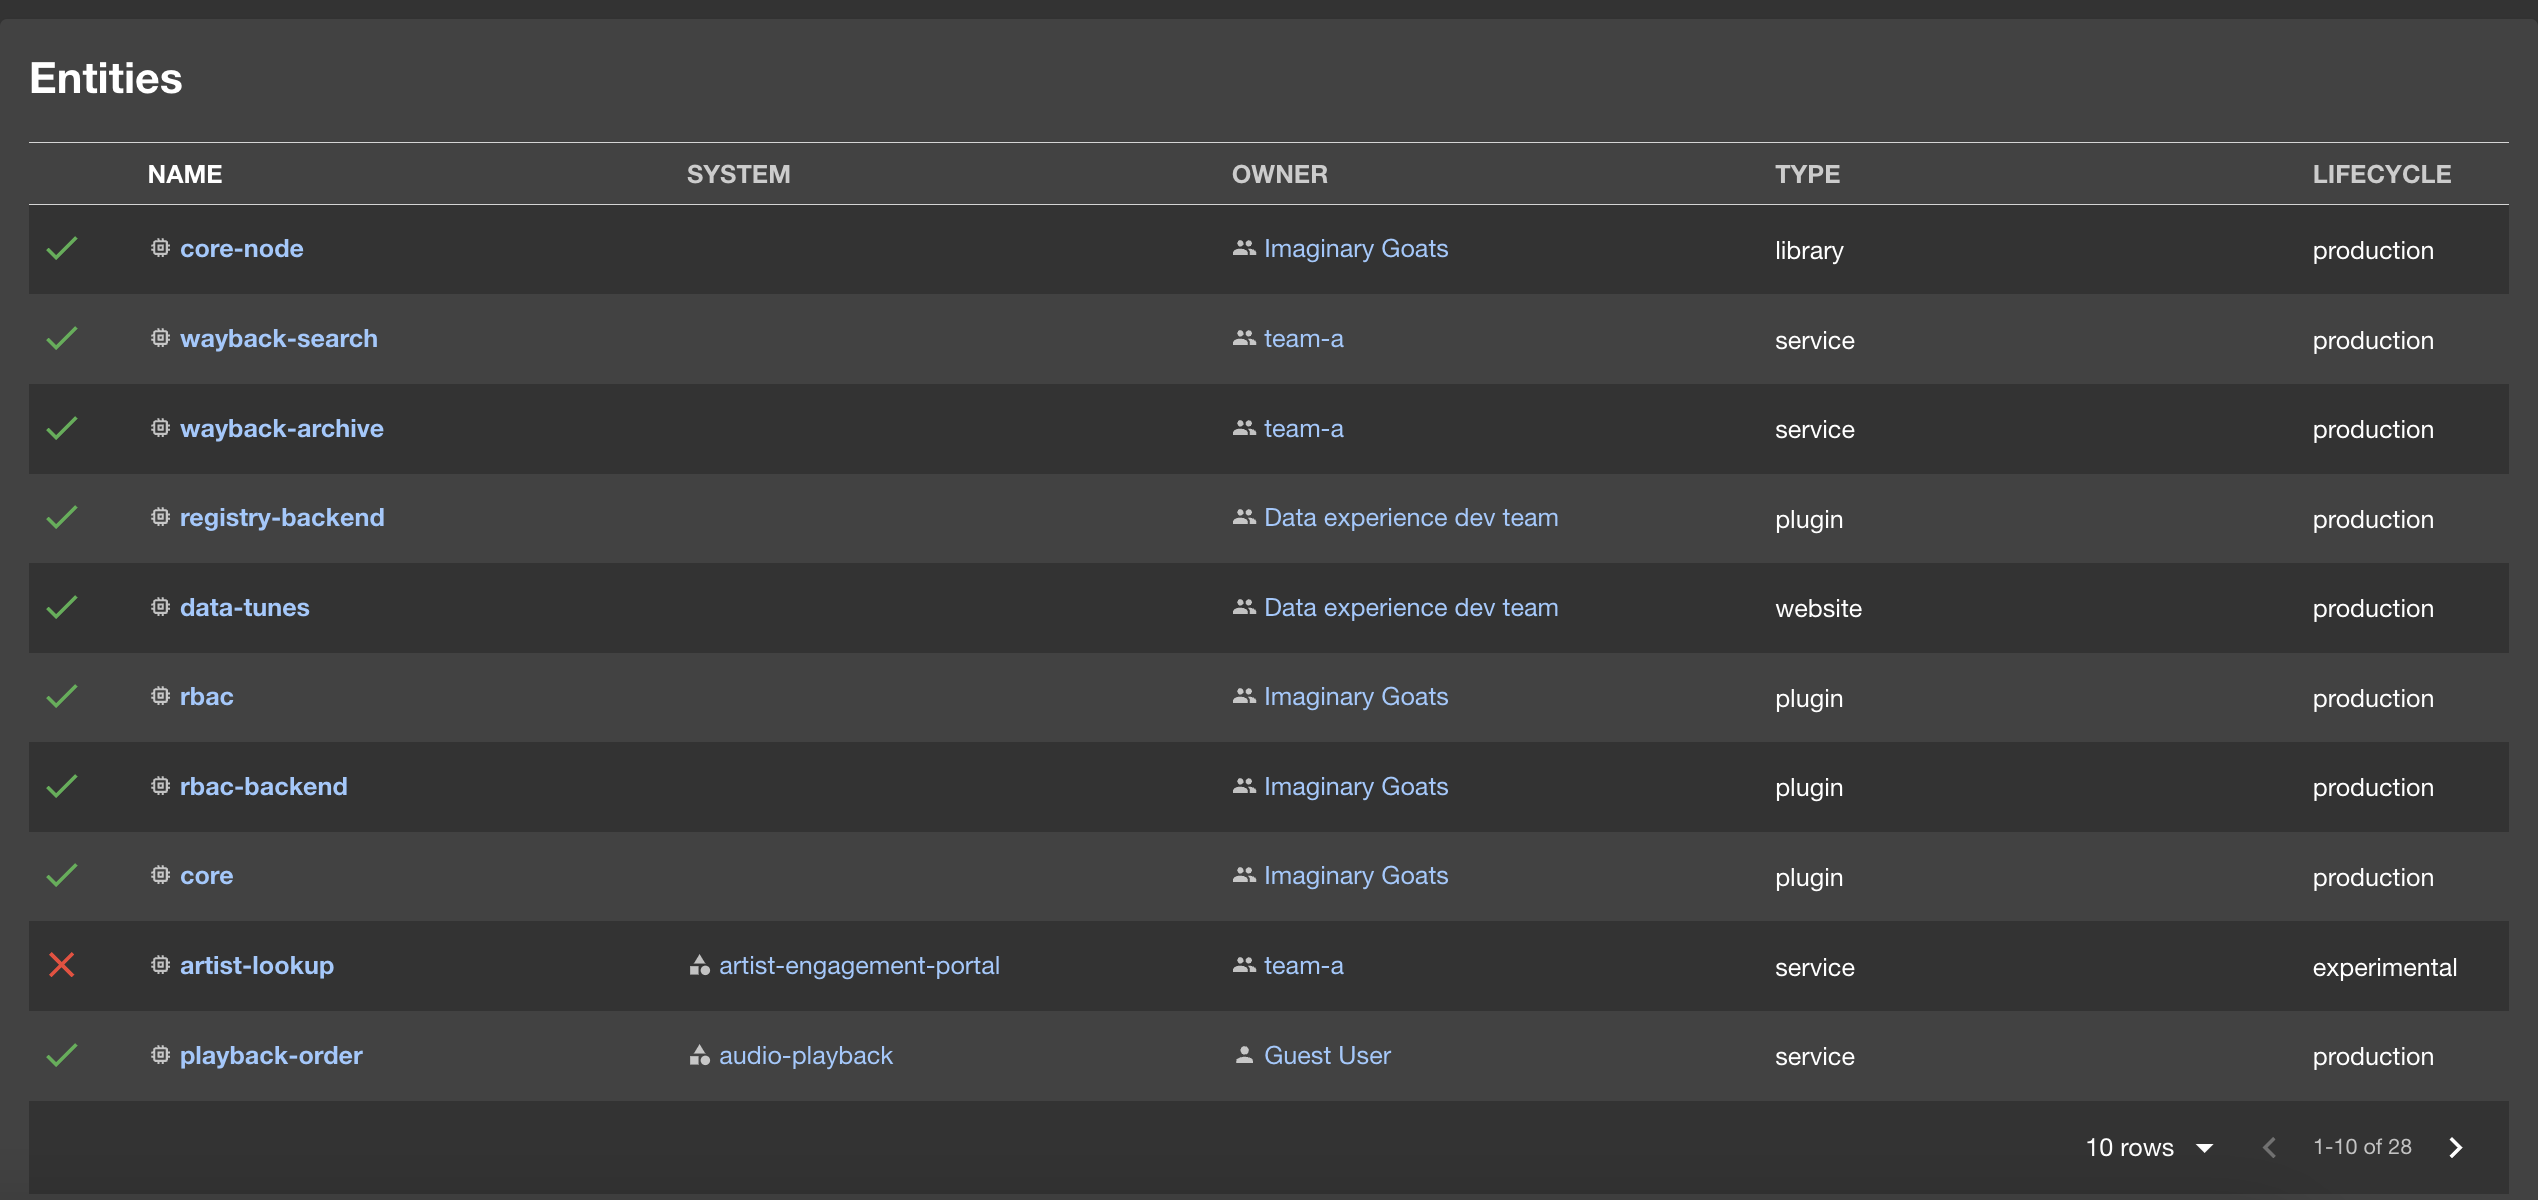
Finally, you can scroll down to see the status of the check for each entity.
Summary
We've seen how the Summary tab provides a high-level overview of your organization's technical health, and how the filters can be used to drill down into the data to assess the technical health of specific tracks, systems, teams, checks, and more. The Summary tab is a great place to start when you want to get a quick overview of your organization's technical health, and the filters provide the ability to quickly get the data you need. The other tabs in Tech-Health provide additional ways to view the data, broken down by entity, check, team, tracks, and campaigns.