

Insights plugin customers must explicitly configure their instance to capture
agentic insights. Follow the instructions in the Setup &
Installation
guide to configure your instance.
Filtering
Global filters allow you to refine your data search based on specific criteria. You can choose from a range of period filters and customize the date range to suit your needs. These filters apply to all the graphs across every tab, providing a seamless and tailored experience. With Insights filtering options, you can be precise and discover exactly what you’re looking for with out-of-the-box and custom defined dimensions on user and entity data.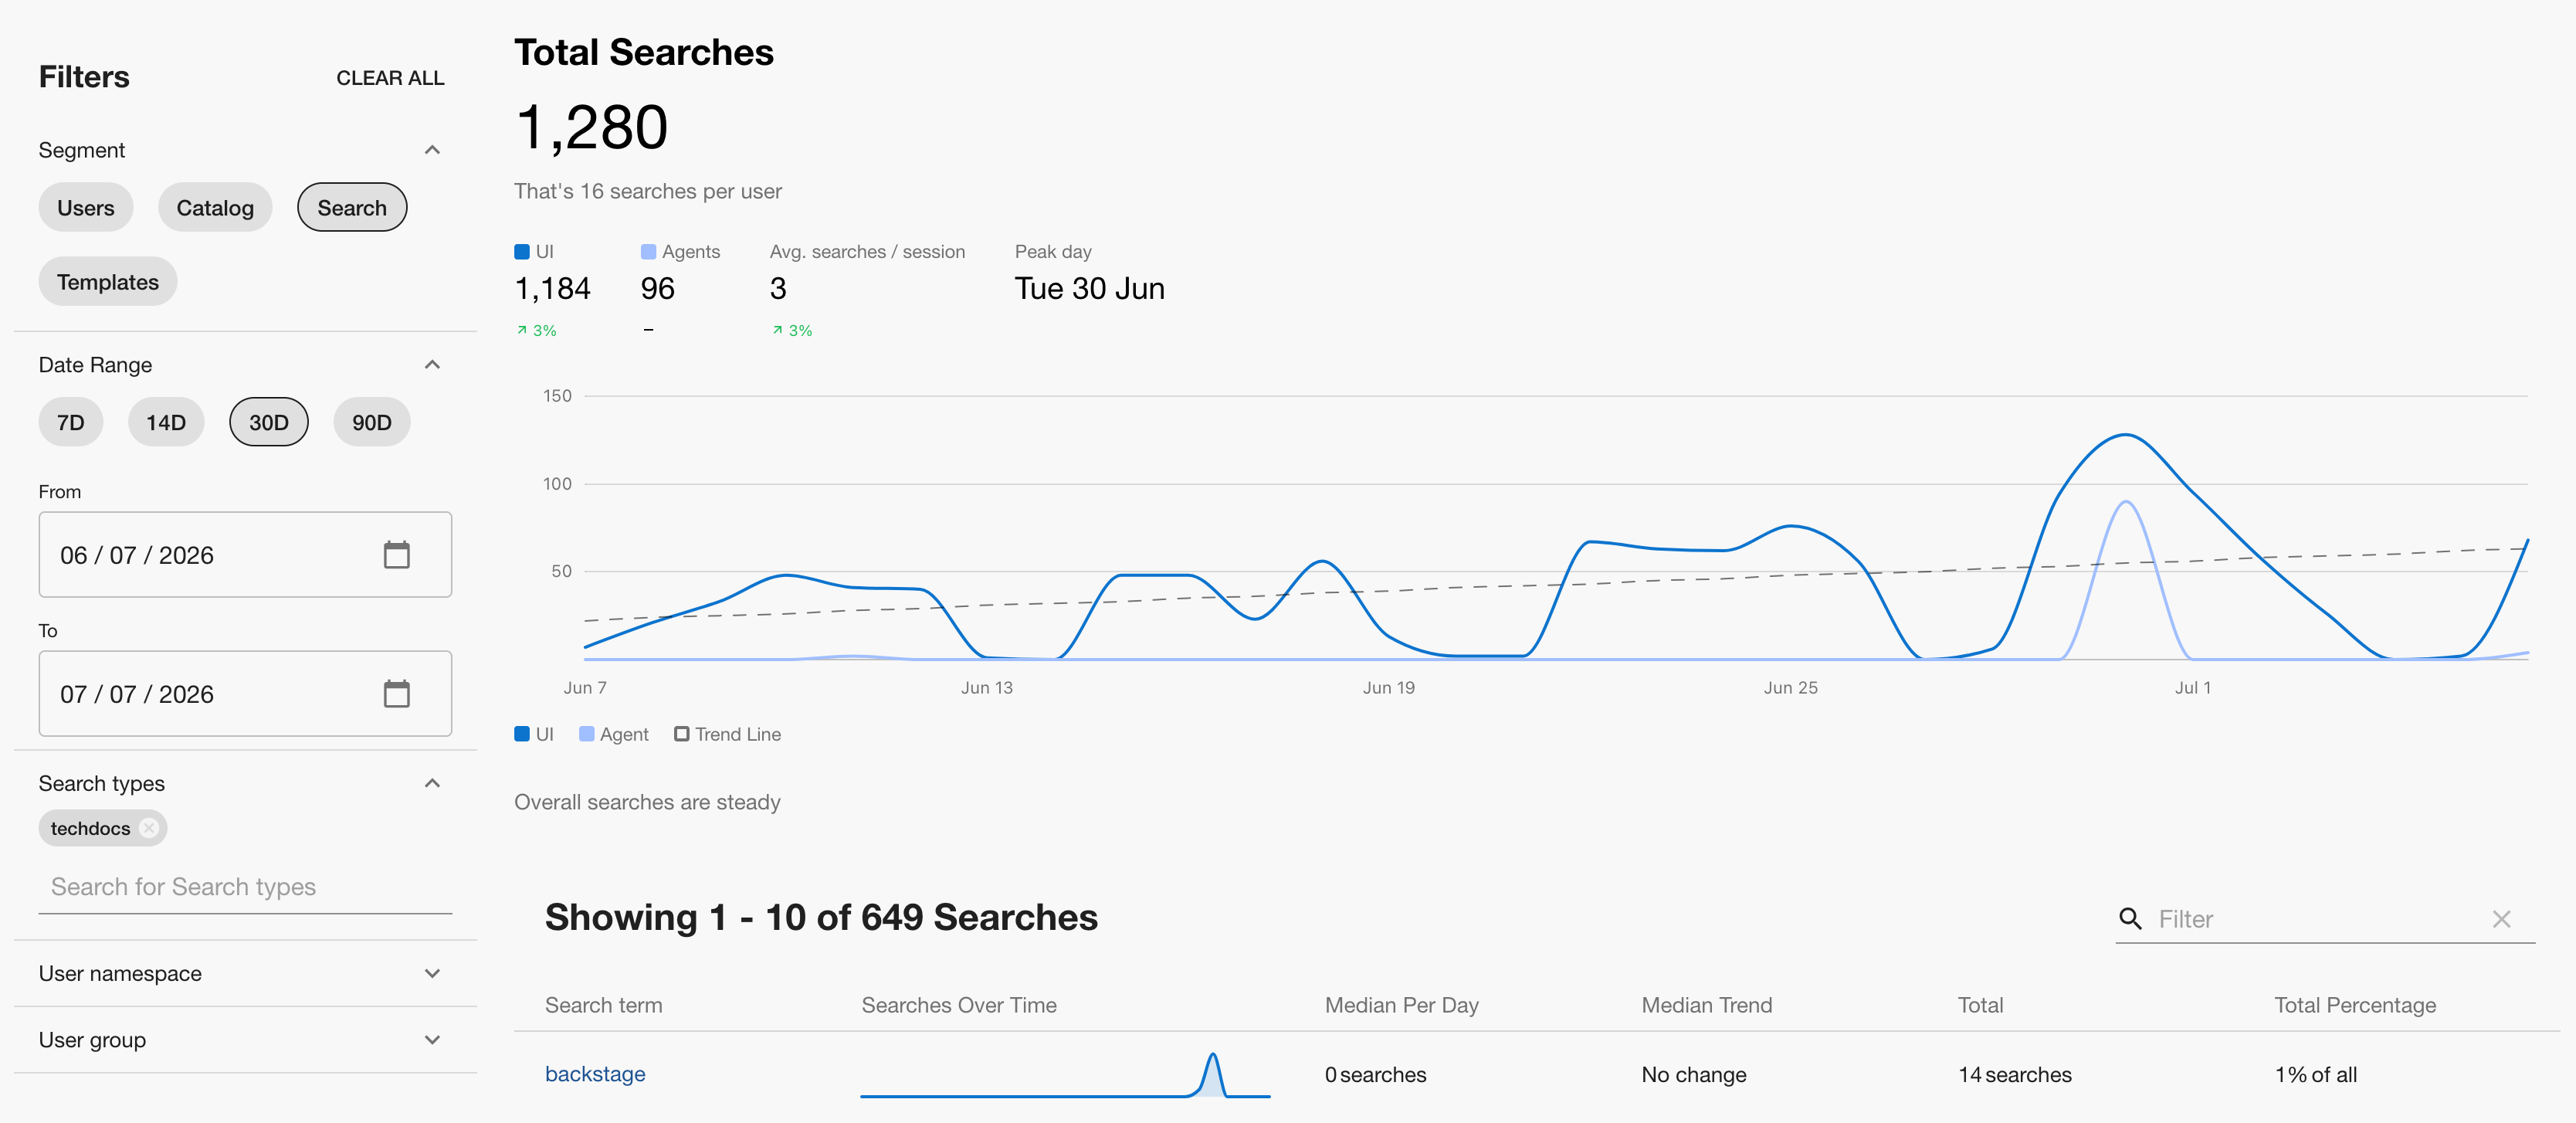
Actions
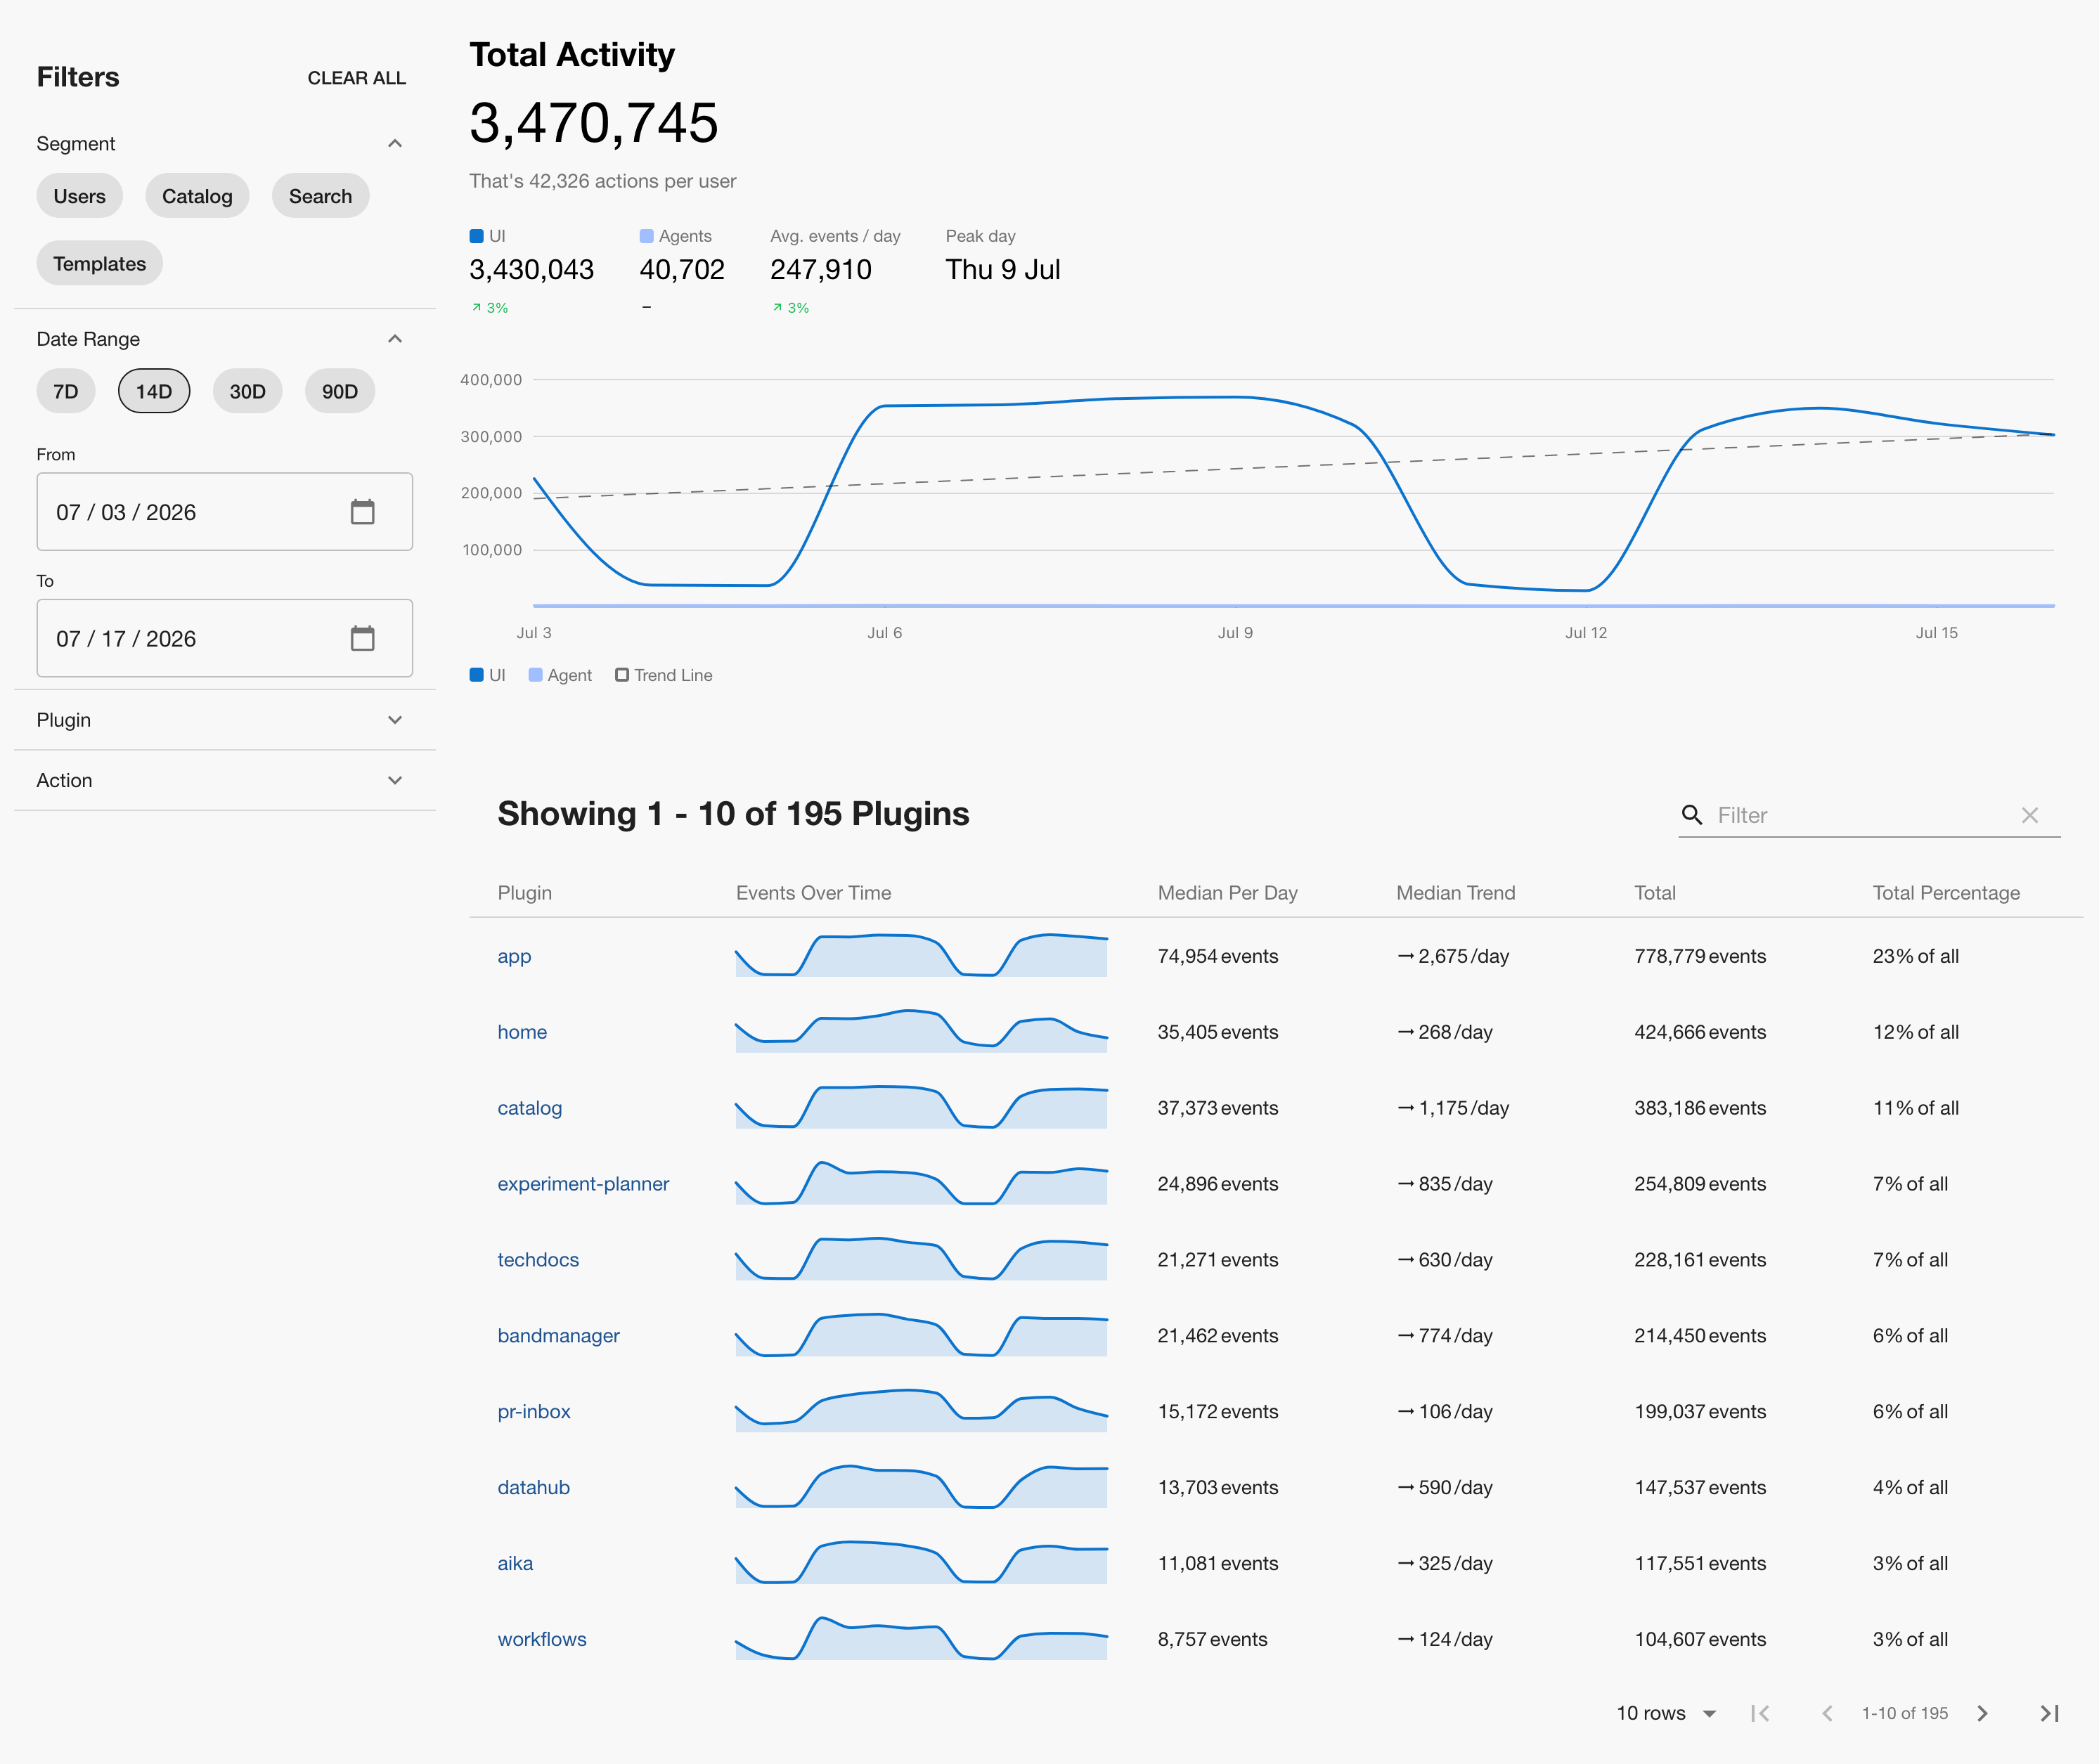
When no segment is selected, you’ll be presented with a view that aggregates all actions taken in your Backstage instance. This is the default view when you first open the Insights plugin. Examples of common actions includeclick, search, or navigate (e.g. a page view).
This view allows you to explore usage data in more detail, where you can filter down and group by plugin or action. Clicking a facet value will drill down on the data by adding it to the filter pane to the left. Further adjusts can be made directly in the filter pane.
Use Cases
-
TechDocs Page Views: You can evaluate high-value TechDocs content by filtering down to plugin
techdocsand actionnavigate, giving you page view counts for every page in TechDocs. -
Catalog UI Usage: Determine which elements on entity pages get the most use by filtering down to plugin
catalogand actionclick. - Custom Plugins: If you have custom plugins installed and have instrumented them with the Plugin Analytics API, your captured events will be visible here.
Users
The Users segment in the Insights plugin shows general user activity in Backstage, tracking total active users (TAU), daily active users (DAU), and a plugin-level breakdown of engagement. It also surfaces AI Agent interactions separately from UI-driven activity, giving you a complete picture of how your organization engages with Backstage. This feature is built for the Backstage champion (e.g. Developer Experience Lead, Director of Platform, Staff/Principal Engineer) that is looking to onboard other teams into Backstage and drive widespread adoption at your organization.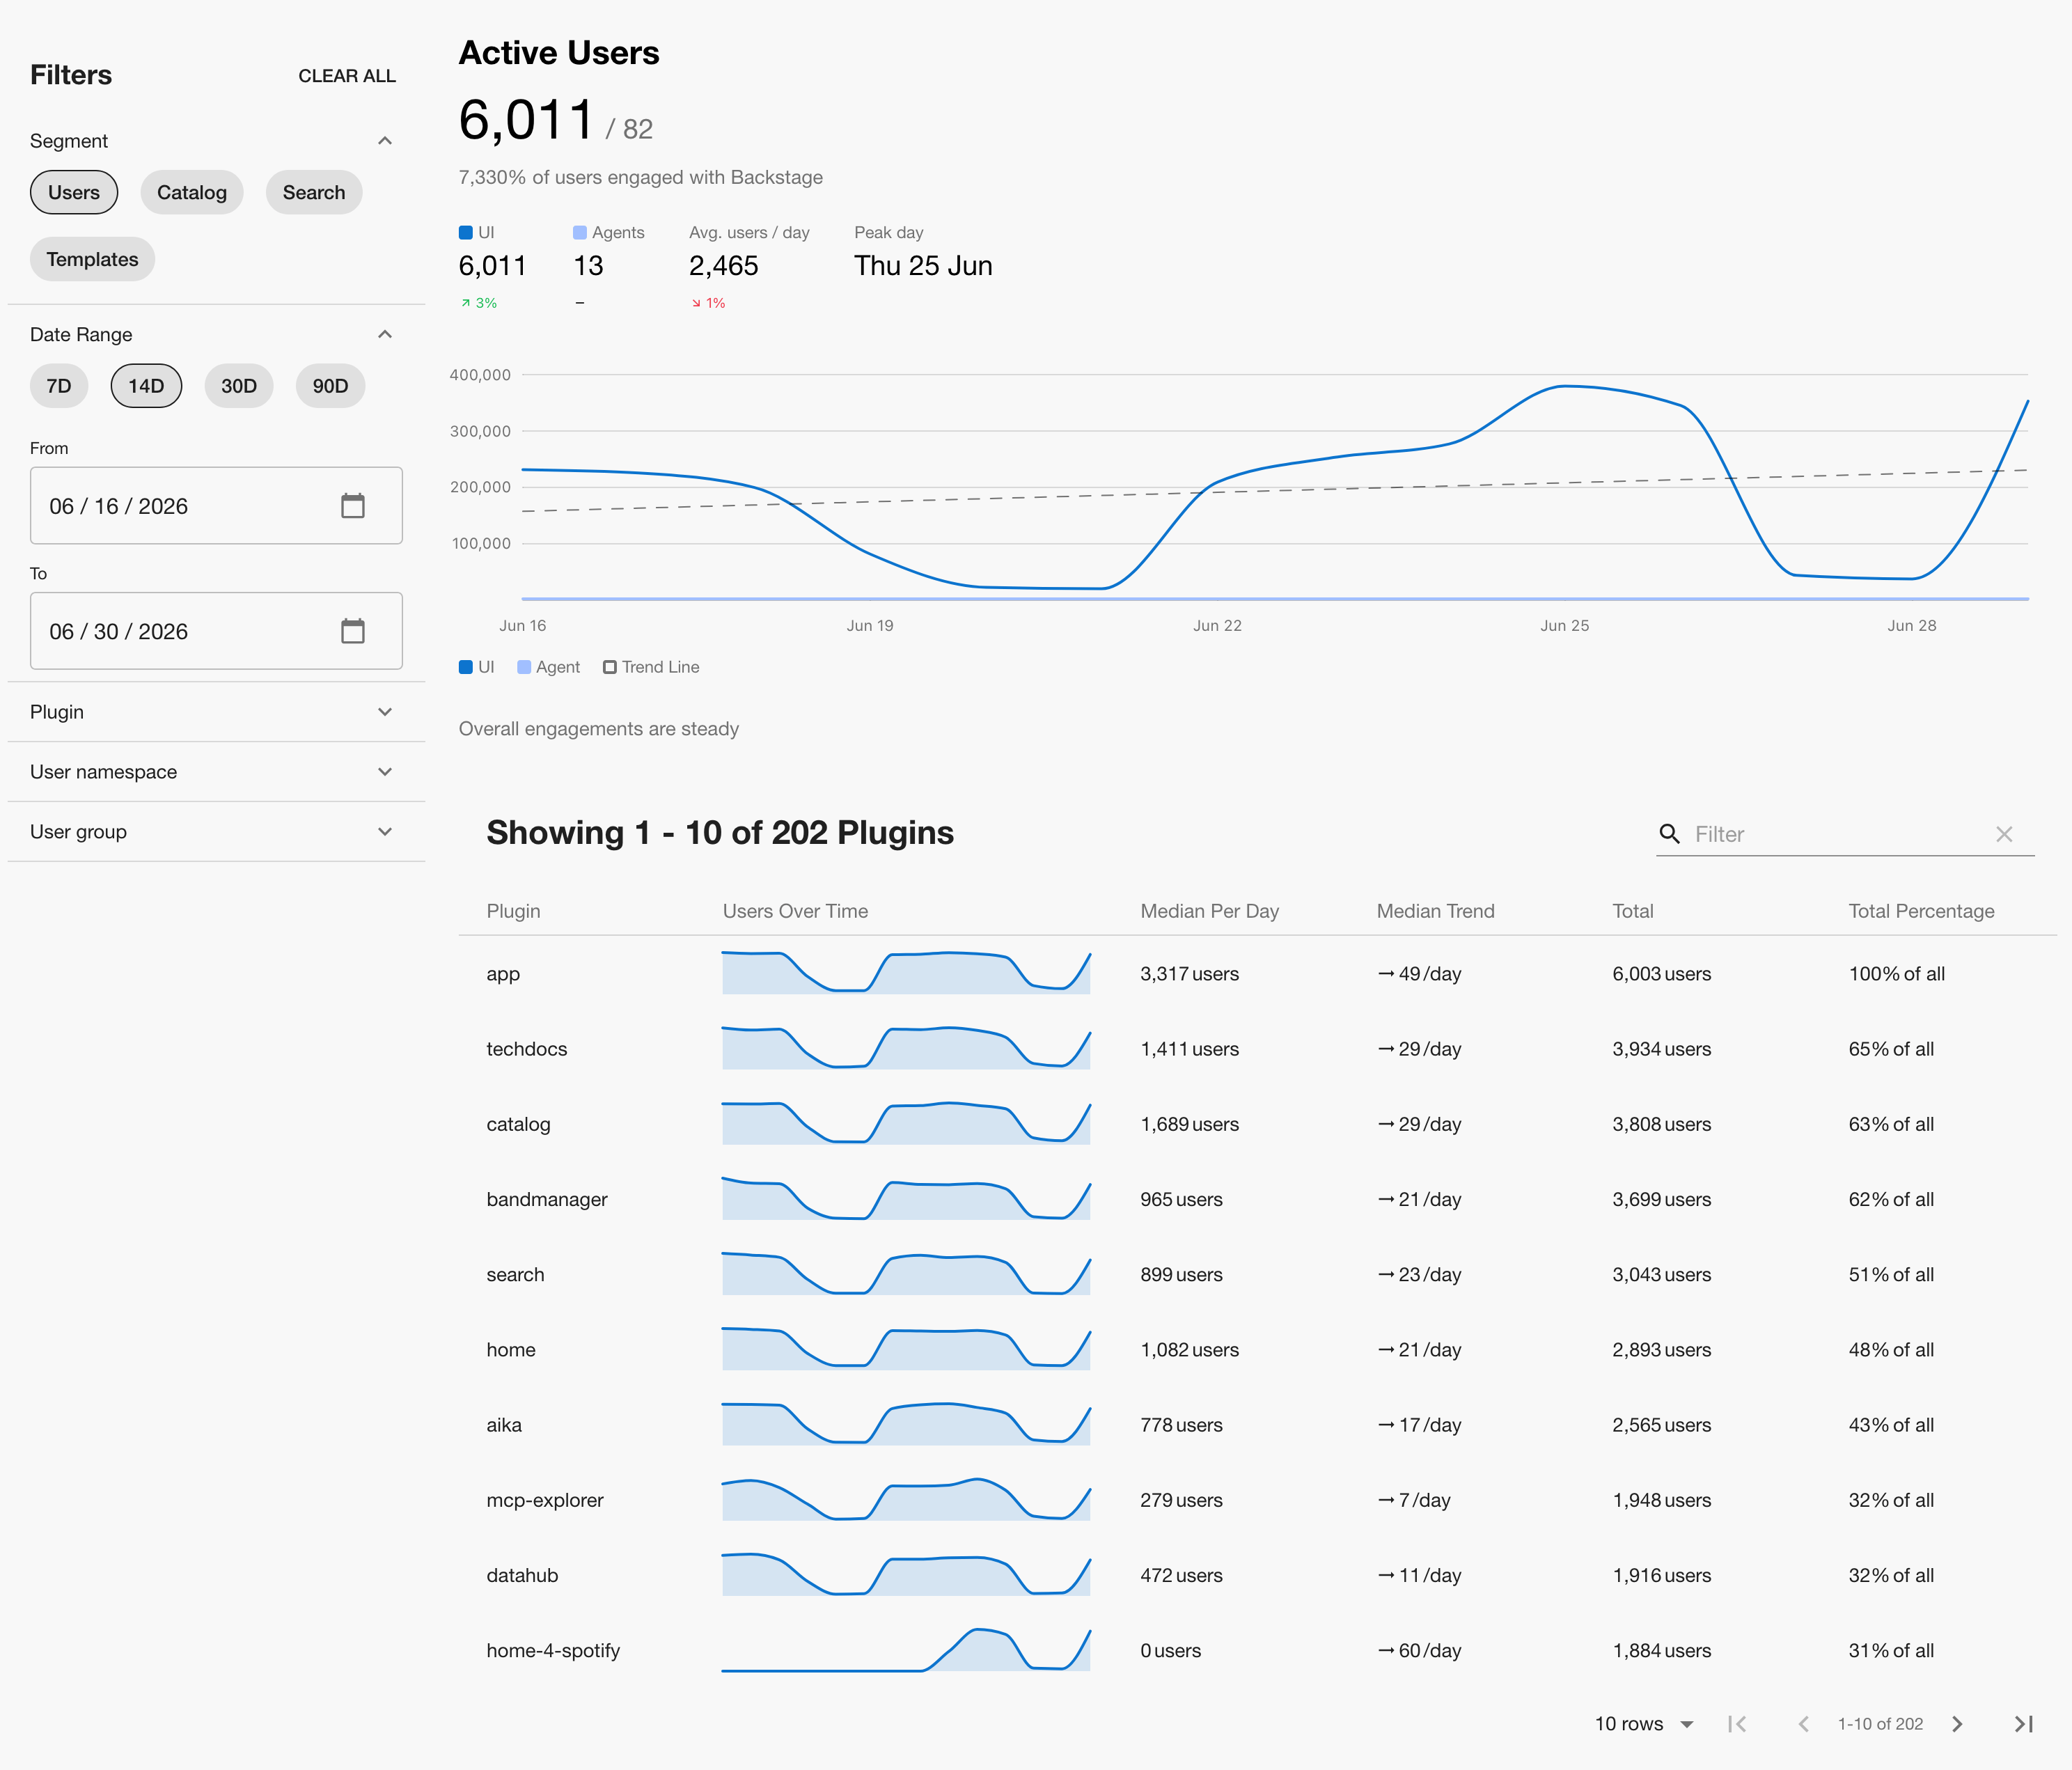
Use Cases
- Share Success with Leadership: The Users segment is a great entry point for leadership, especially those responsible for the overall investment in your Backstage program. This view gives a quick overview of the crucial first step in Backstage success at your company: adoption.
- User Onboarding: The Users segment can help the Backstage champion onboard new users into their Backstage instance. By providing insights on TAU and DAU, and allowing them to be segmented, the Backstage champion can track user activity and engagement. This information can be used to identify areas where the team(s) driving adoption may need additional support or training, ensuring a smooth onboarding process.
- User Engagement Analysis: Track DAU and monitor trends in user activity to assess user engagement. Champions can identify any drops or spikes in engagement and investigate the reasons behind them. This analysis can help improve the user experience, identify areas of improvement, and take appropriate actions to boost user engagement.
- Performance Evaluation: Measure the performance of your Backstage app by monitoring the total active users over time. This information can be used to measure growth and adoption, and evaluate the effectiveness of initiatives aimed at increasing user participation and to make data-driven decisions for future improvements.
- Resource Allocation: Data from the Users segment can assist in resource allocation decisions by providing insights into user activity. The Backstage champion can use the data to identify teams or departments that are highly active or less engaged. This information can help allocate resources, such as training or support, to areas that require attention or to further enhance the adoption of Backstage within the organization.
- Benchmarking and Goal-Setting: Set benchmarks and goals for user activity. By analyzing the charts and tracking the progress of DAU, the champion can establish realistic targets for increasing user engagement. This feature also provides a way to measure the success of initiatives aimed at achieving these goals.
Total Active Users (TAU)
TAU is displayed as a headline alongside an engagement percentage, giving you an at-a-glance read of Backstage stickiness for the selected period (up to 90 days in the past). Below the headline, a summary row breaks the figure down further:- UI — users who engaged through the Backstage web interface
- Agents — interactions driven by AI Agents
- Avg. users / day — the daily median across the selected period
- Peak day — the single day with the highest user count
Daily Active Users (DAU)
The DAU chart showcases the trends in Backstage usage by visualizing the number of users who are active on a daily basis. This view helps identify patterns and gain valuable insights into user behavior over time.Plugin Breakdown
Below the trend chart, the Active Users view includes a table listing the top plugins by user activity. For each plugin the table shows:- Users Over Time — a sparkline of activity across the selected period
- Median Per Day — the typical daily user count
- Median Trend — the day-over-day change in the median
- Total — cumulative unique users for the period
- Total Percentage — share of all active users who engaged with the plugin
Catalog
The Catalog segment offers a granular view of Software Catalog usage data, showing the entities that have been accessed in a given period sorted by the number of visits. Similar to the Users segment, data in the Catalog can be filtered by the out-of-the-box provided dimensions of entity kind, lifecycle, namespace, owner, and type, but also any custom entity dimensions that have been configured.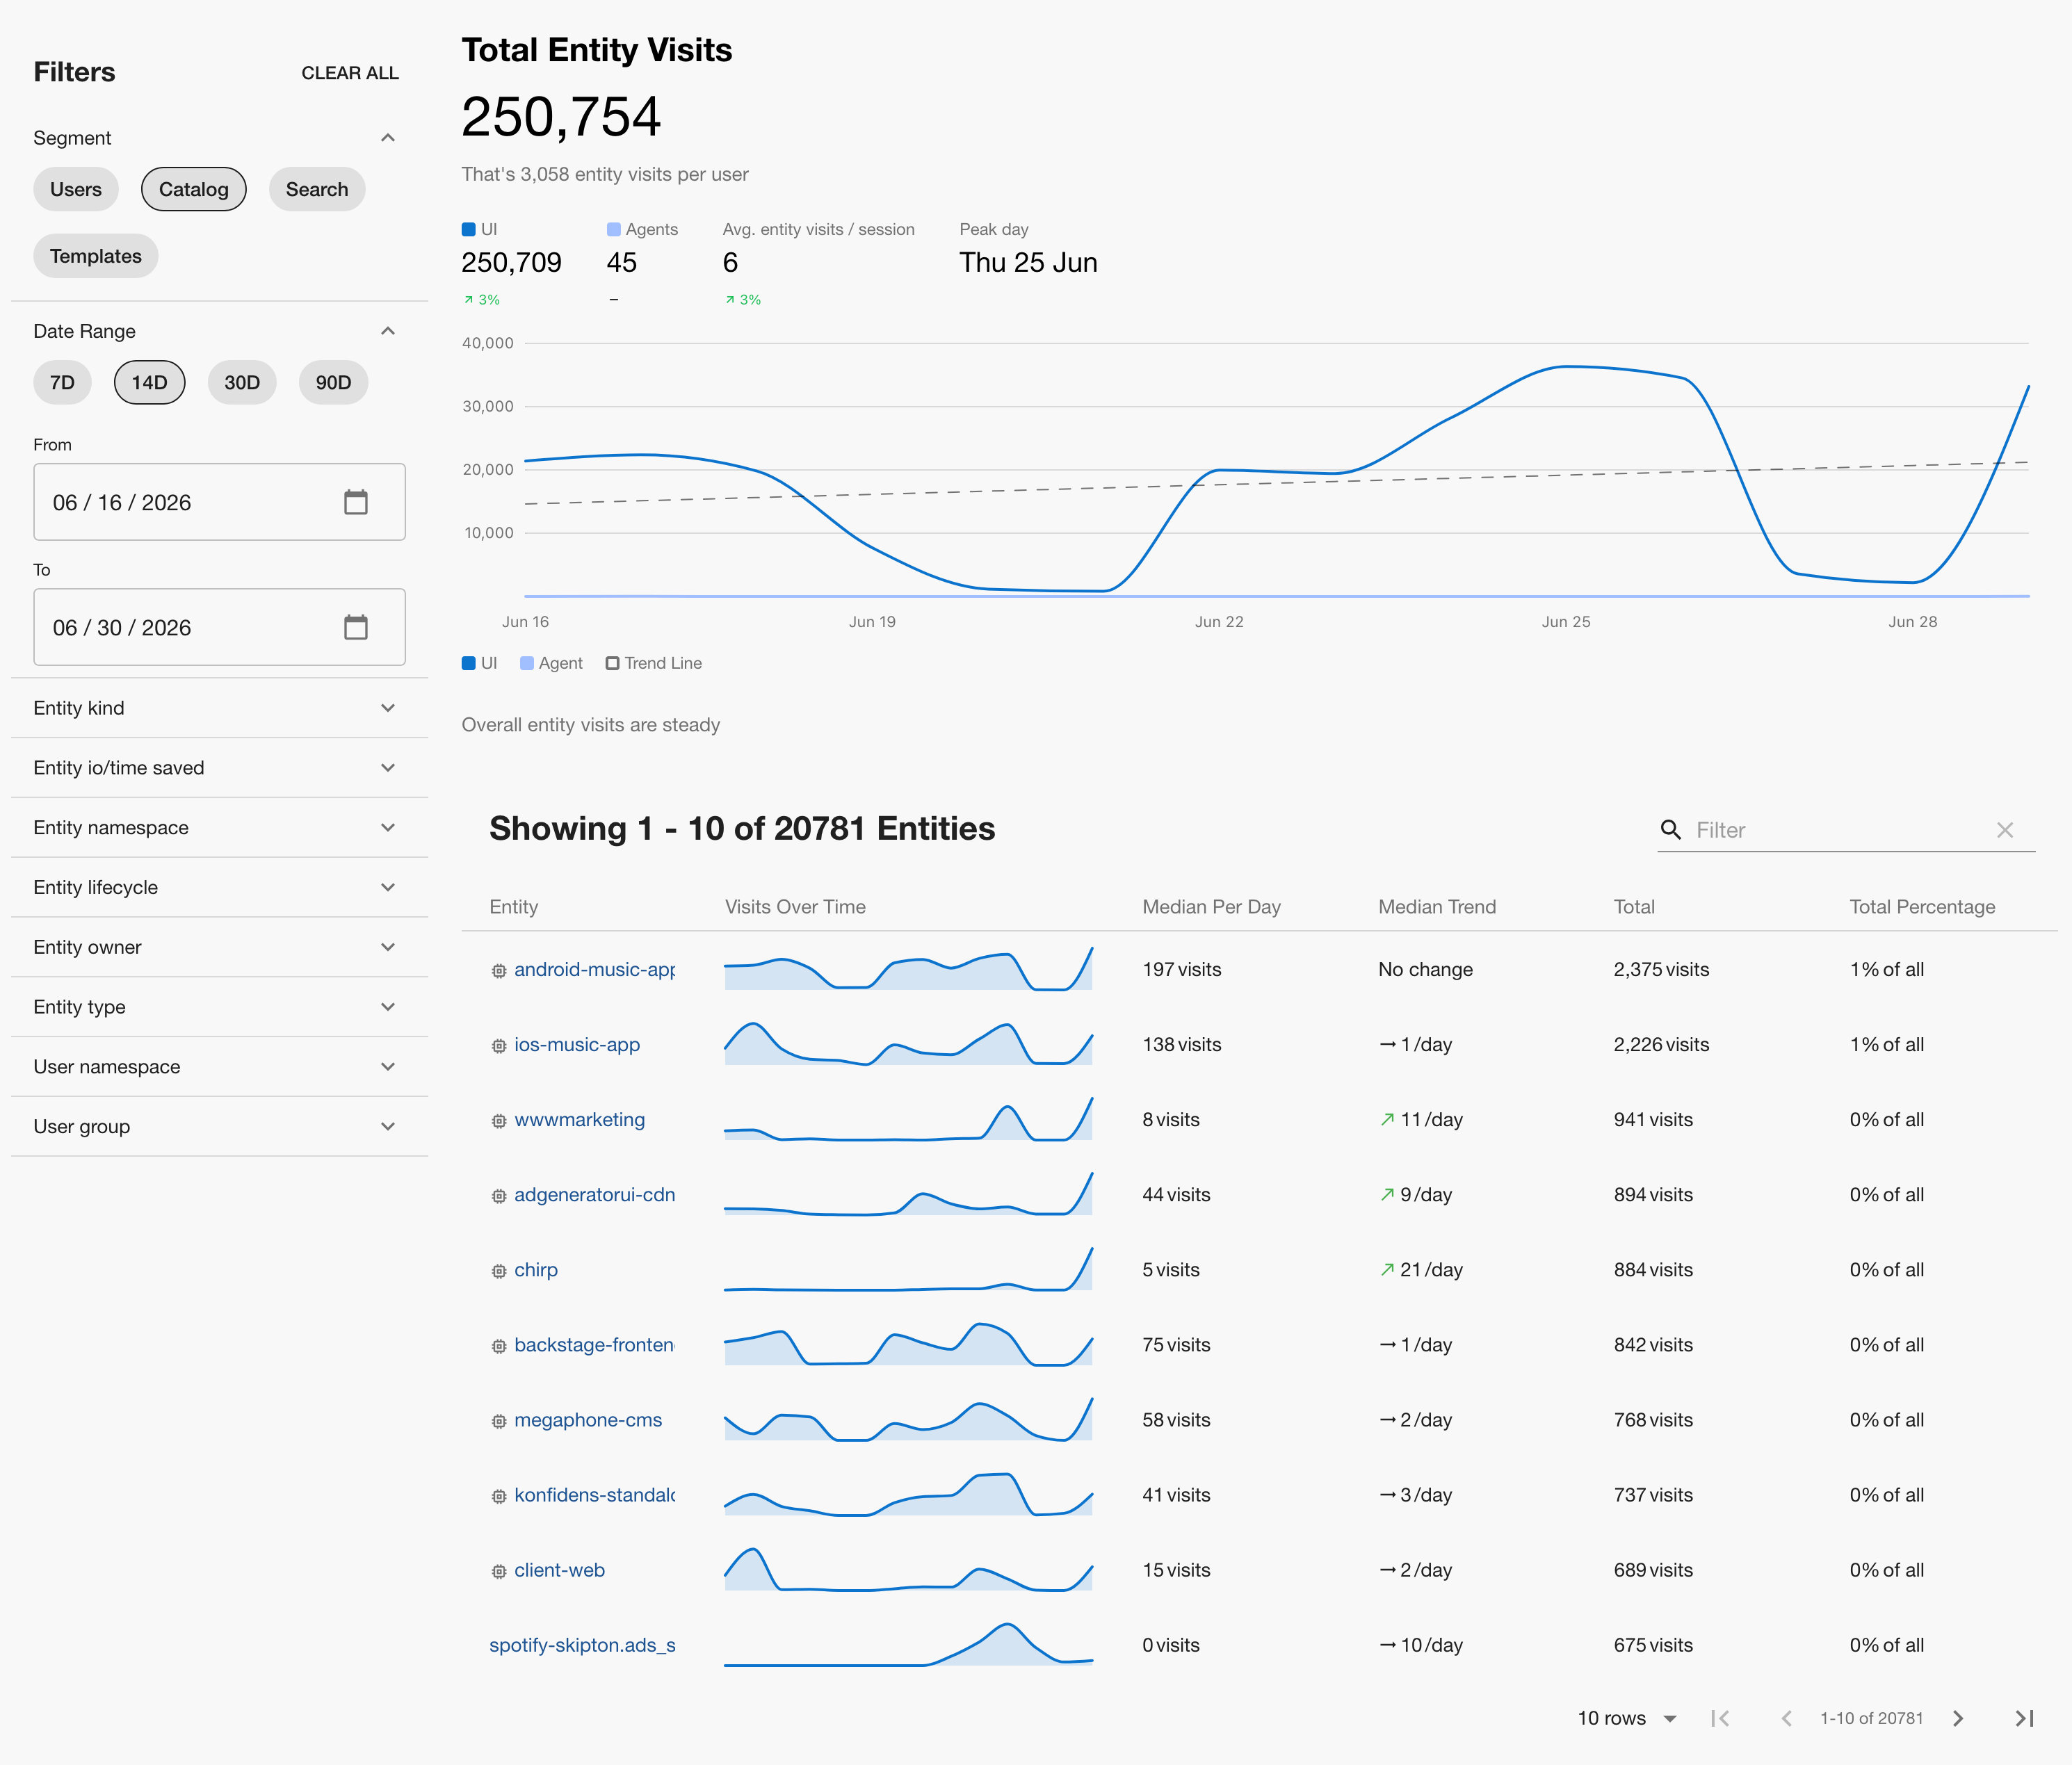
Use Cases
- Unleash the Potential of Your Most Popular Entities: Identify which entities are receiving the most traffic and leverage these individuals as your champions. They are the key adopters who can inspire and influence the rest of the organization. Take the opportunity to interview these owners and understand the reasons behind their popularity.
Search
The Search segment offers a granular view of Backstage Search usage data. It surfaces total searches — broken down by UI and AI Agent interactions — daily search trends, and a ranked table of top search terms. These views help admins identify trends and get a better understanding of what users are looking for most often.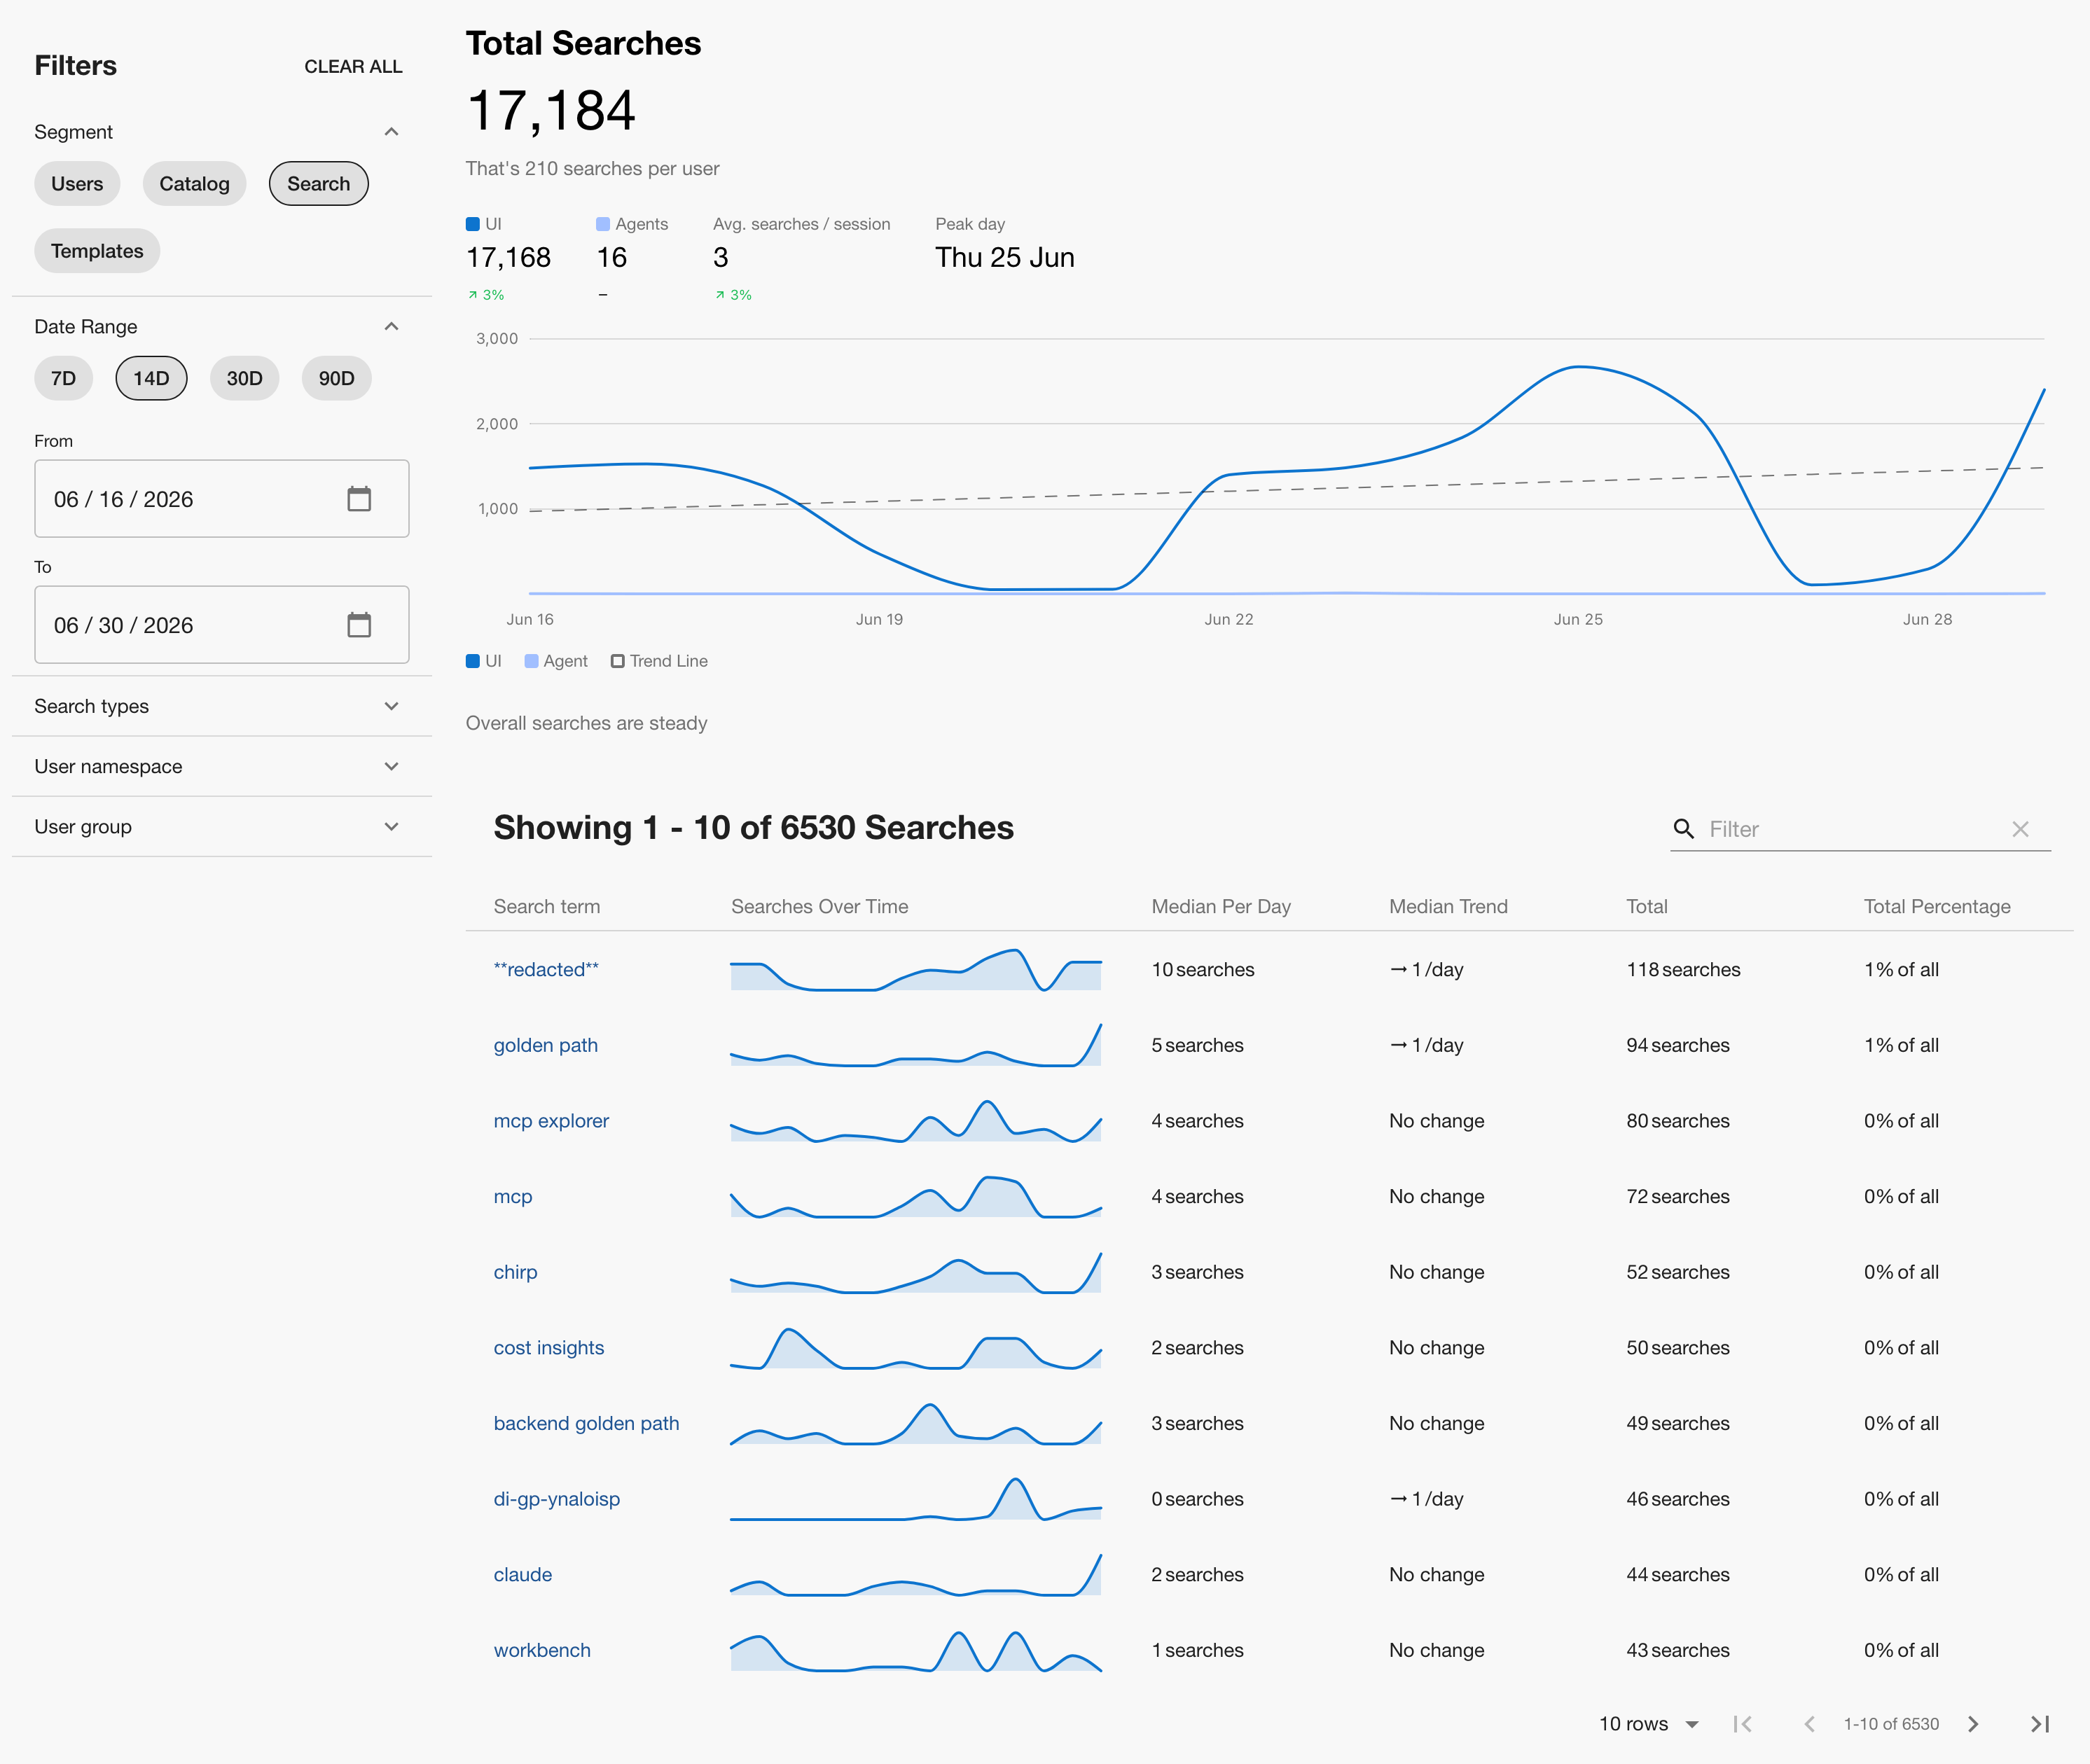
Use Cases
- Evaluate Search Functionality Effectiveness: Use Insights to gain a deep understanding of how your search feature performs within your Backstage instance. By analyzing comprehensive metrics and user behavior patterns, you can uncover invaluable data into the effectiveness of your search functionality.
- Gain Visibility into What Users Are Looking For: Peek into the minds of your users and gain unparalleled visibility into what they are searching for. By capturing and analyzing user search queries, you can learn and optimize search capabilities accordingly or rethink architecture and UI decisions within your Backstage instance. For example, if the highest volume of search queries is for a specific plugin, that’s a good signal it should be more visible on the sidebar.
- Assess Impact of Changes or Improvements: Measure the success of your search feature enhancements by comparing search data from different periods. Our comprehensive analytics reports allow you to assess the impact of changes or improvements, empowering you to make data-driven decisions for continuous optimization.
- Track Daily Count of Searches: Quantify the popularity and usage of your search feature with real-time data tracking. Our advanced analytics engine provides you with daily metrics on the number of daily searches, giving you a pulse on user engagement and search trends.
Total Searches
Track the daily count of searches performed by users. This data provides valuable insights into the popularity and usage of the Backstage Search feature. Use this information to understand if users are actively utilizing the search functionality to discover new content.- UI — searches performed through the Backstage web interface
- Agents — searches driven by AI Agents
- Avg. searches / session — the average number of searches per user session
- Peak day — the single day with the highest search volume
Daily Search Trends
The daily search trend is visualized as a line chart embedded directly in the Search view. The chart plots UI and Agent search activity as separate lines over the selected period, with a dashed Trend Line to surface the overall direction of activity. An at-a-glance summary beneath the chart (e.g. “Overall searches are steady”) gives you an immediate read on current trends.Top Search Queries
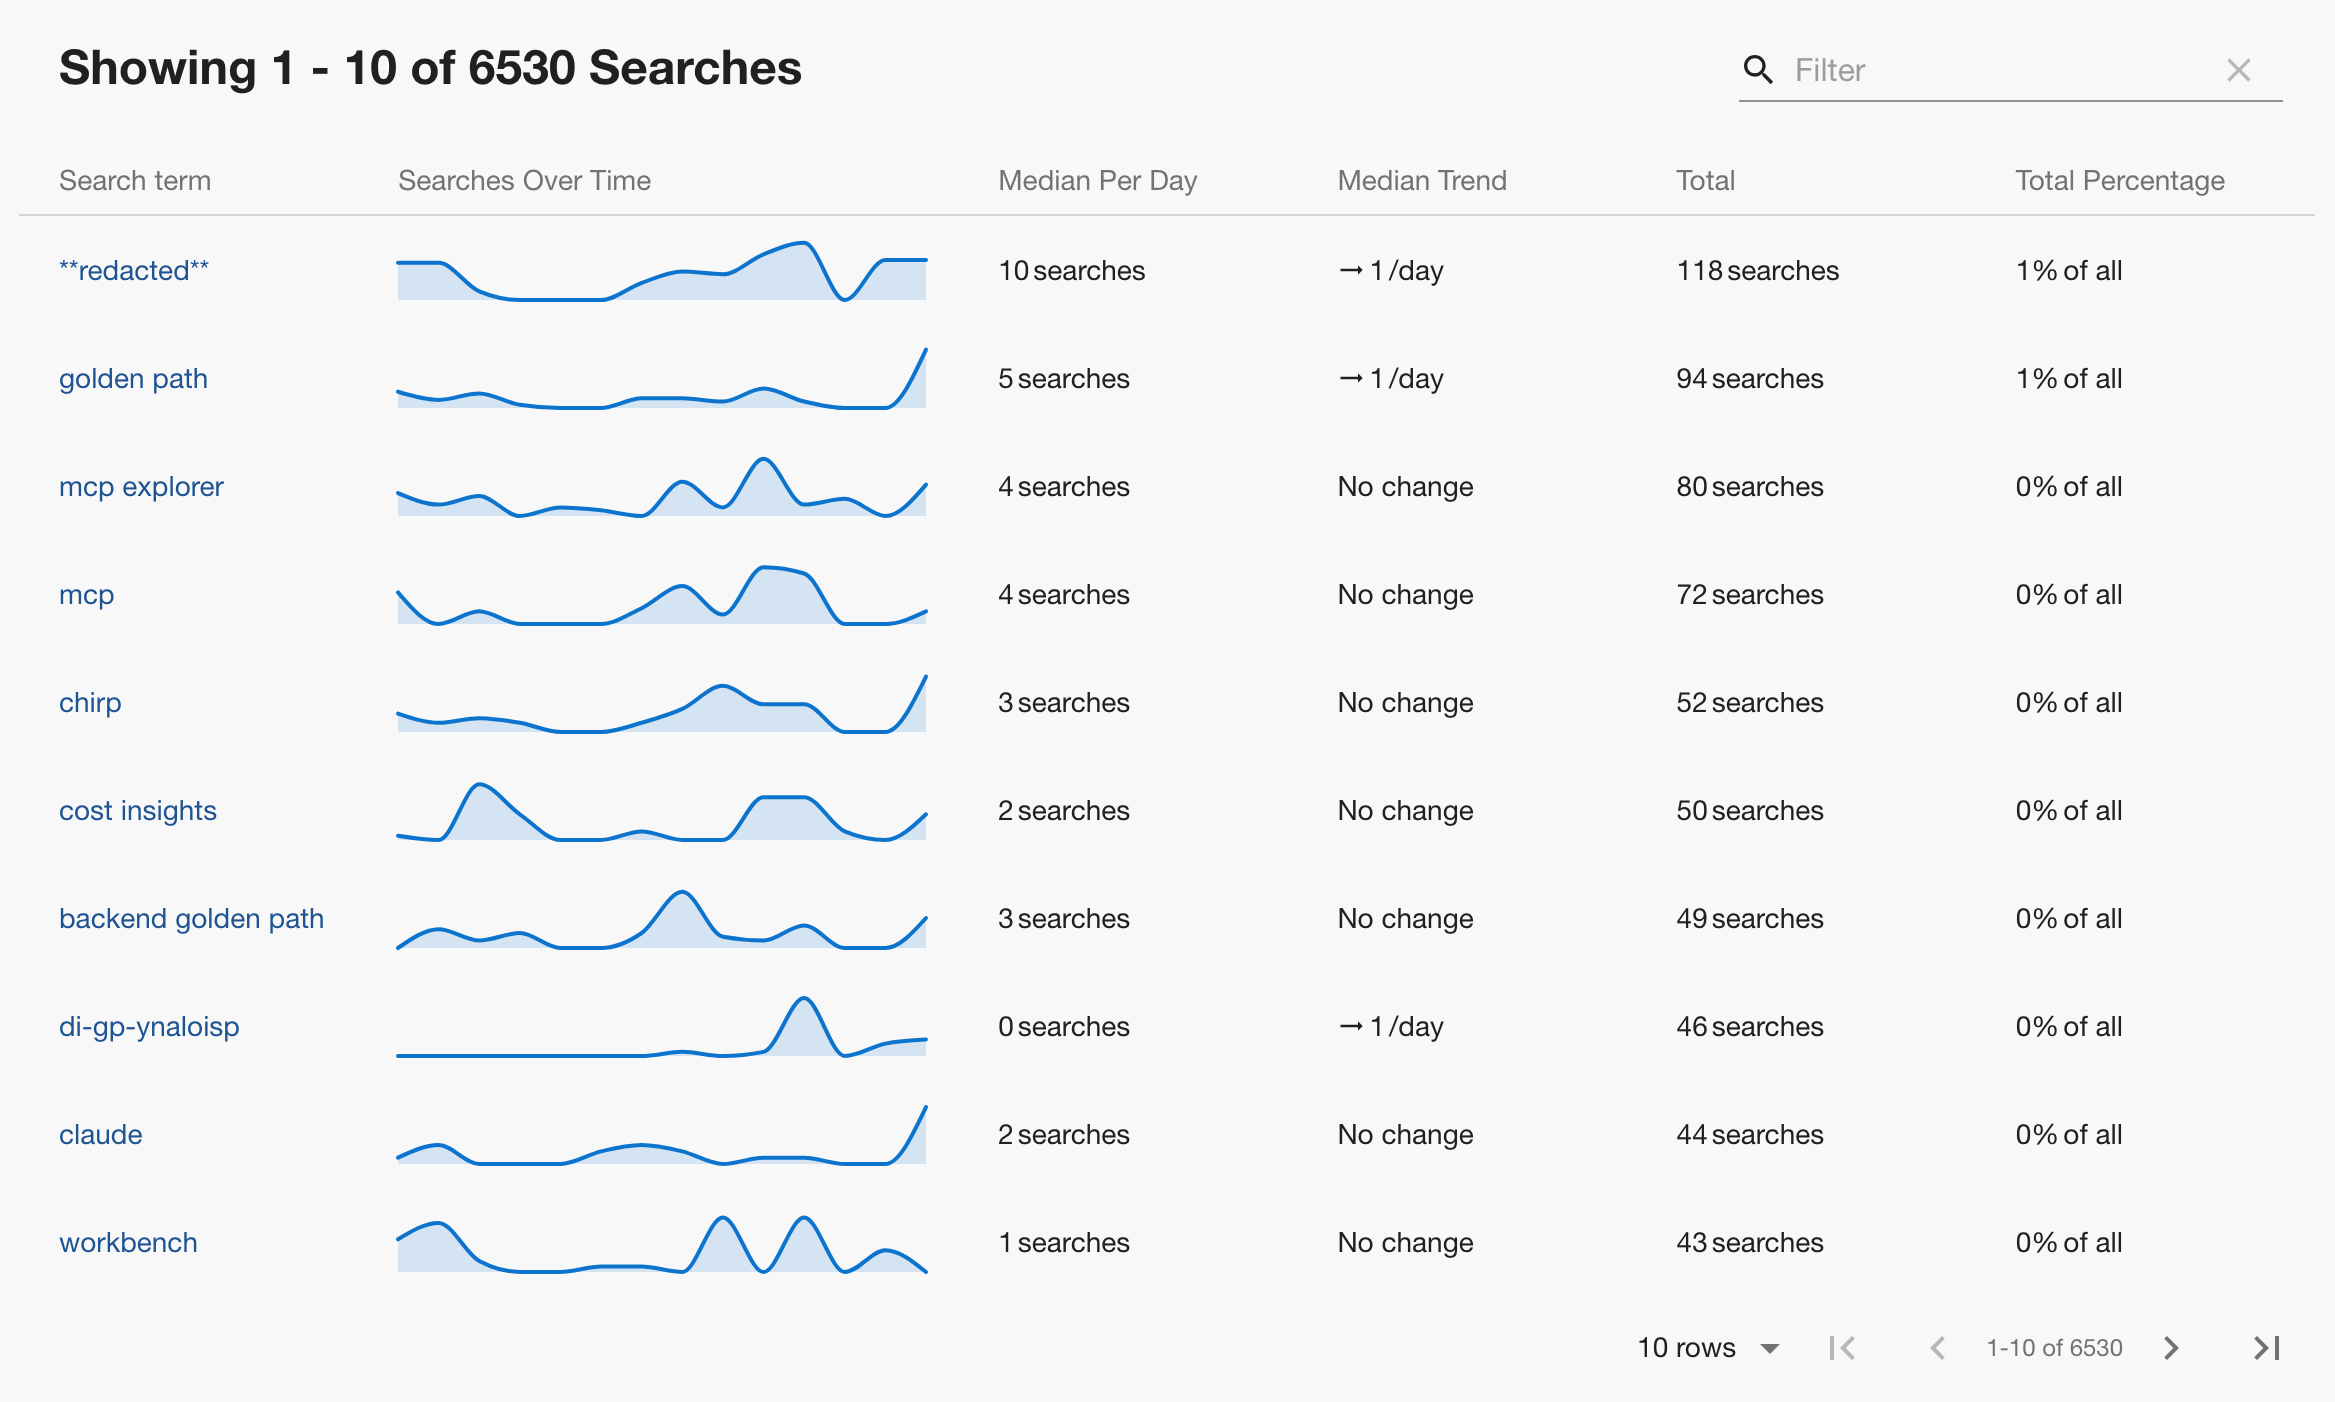
Gain visibility into what people are searching for and optimize your search capabilities accordingly. Identify if your search is optimized and ensure that users can find the content they are looking for. Analyze patterns and tailor your search results to meet user expectations.- Searches Over Time — a sparkline of search frequency across the selected period
- Median Per Day — the typical daily search count
- Median Trend — the day-over-day change in the median
- Total — cumulative search count for the period
- Total Percentage — share of all searches accounted for by this term
Optimizing Search Term Capture
When capturing search term events for Insights, you may encounter an issue where incomplete search terms (i.e. 1-3 character terms) “top your charts” in your Insights dashboard. TheSearchBar in Backstage uses a debounce mechanism to control how frequently search query events are captured. The default debounce time is set to “200 ms”, which may not be ideal for all users. If the debounce time is too short, partial search queries might be sent, leading to inaccurate search data.
To address this issue, you can increase the debounceTime property via the debounceTime prop for the SearchBar component allowing more time for users to fully input their search query before the event is captured. The debounceTime also controls when your search results preview is refreshed in the UI so it’s advised to not set it too high.
Wherever you are using the out of the box, open source SearchBar component, you can simply adjust debounce by passing in a number (duration in ms) value like below:
Templates
Stay informed about your team’s Software Template usage. Track execution counts, time savings, and daily trends of the templates that your team relies on the most. These features are designed to benefit both template owners, who can assess their template’s usage, and Backstage admins or champions, who can evaluate the comparative usage of different templates.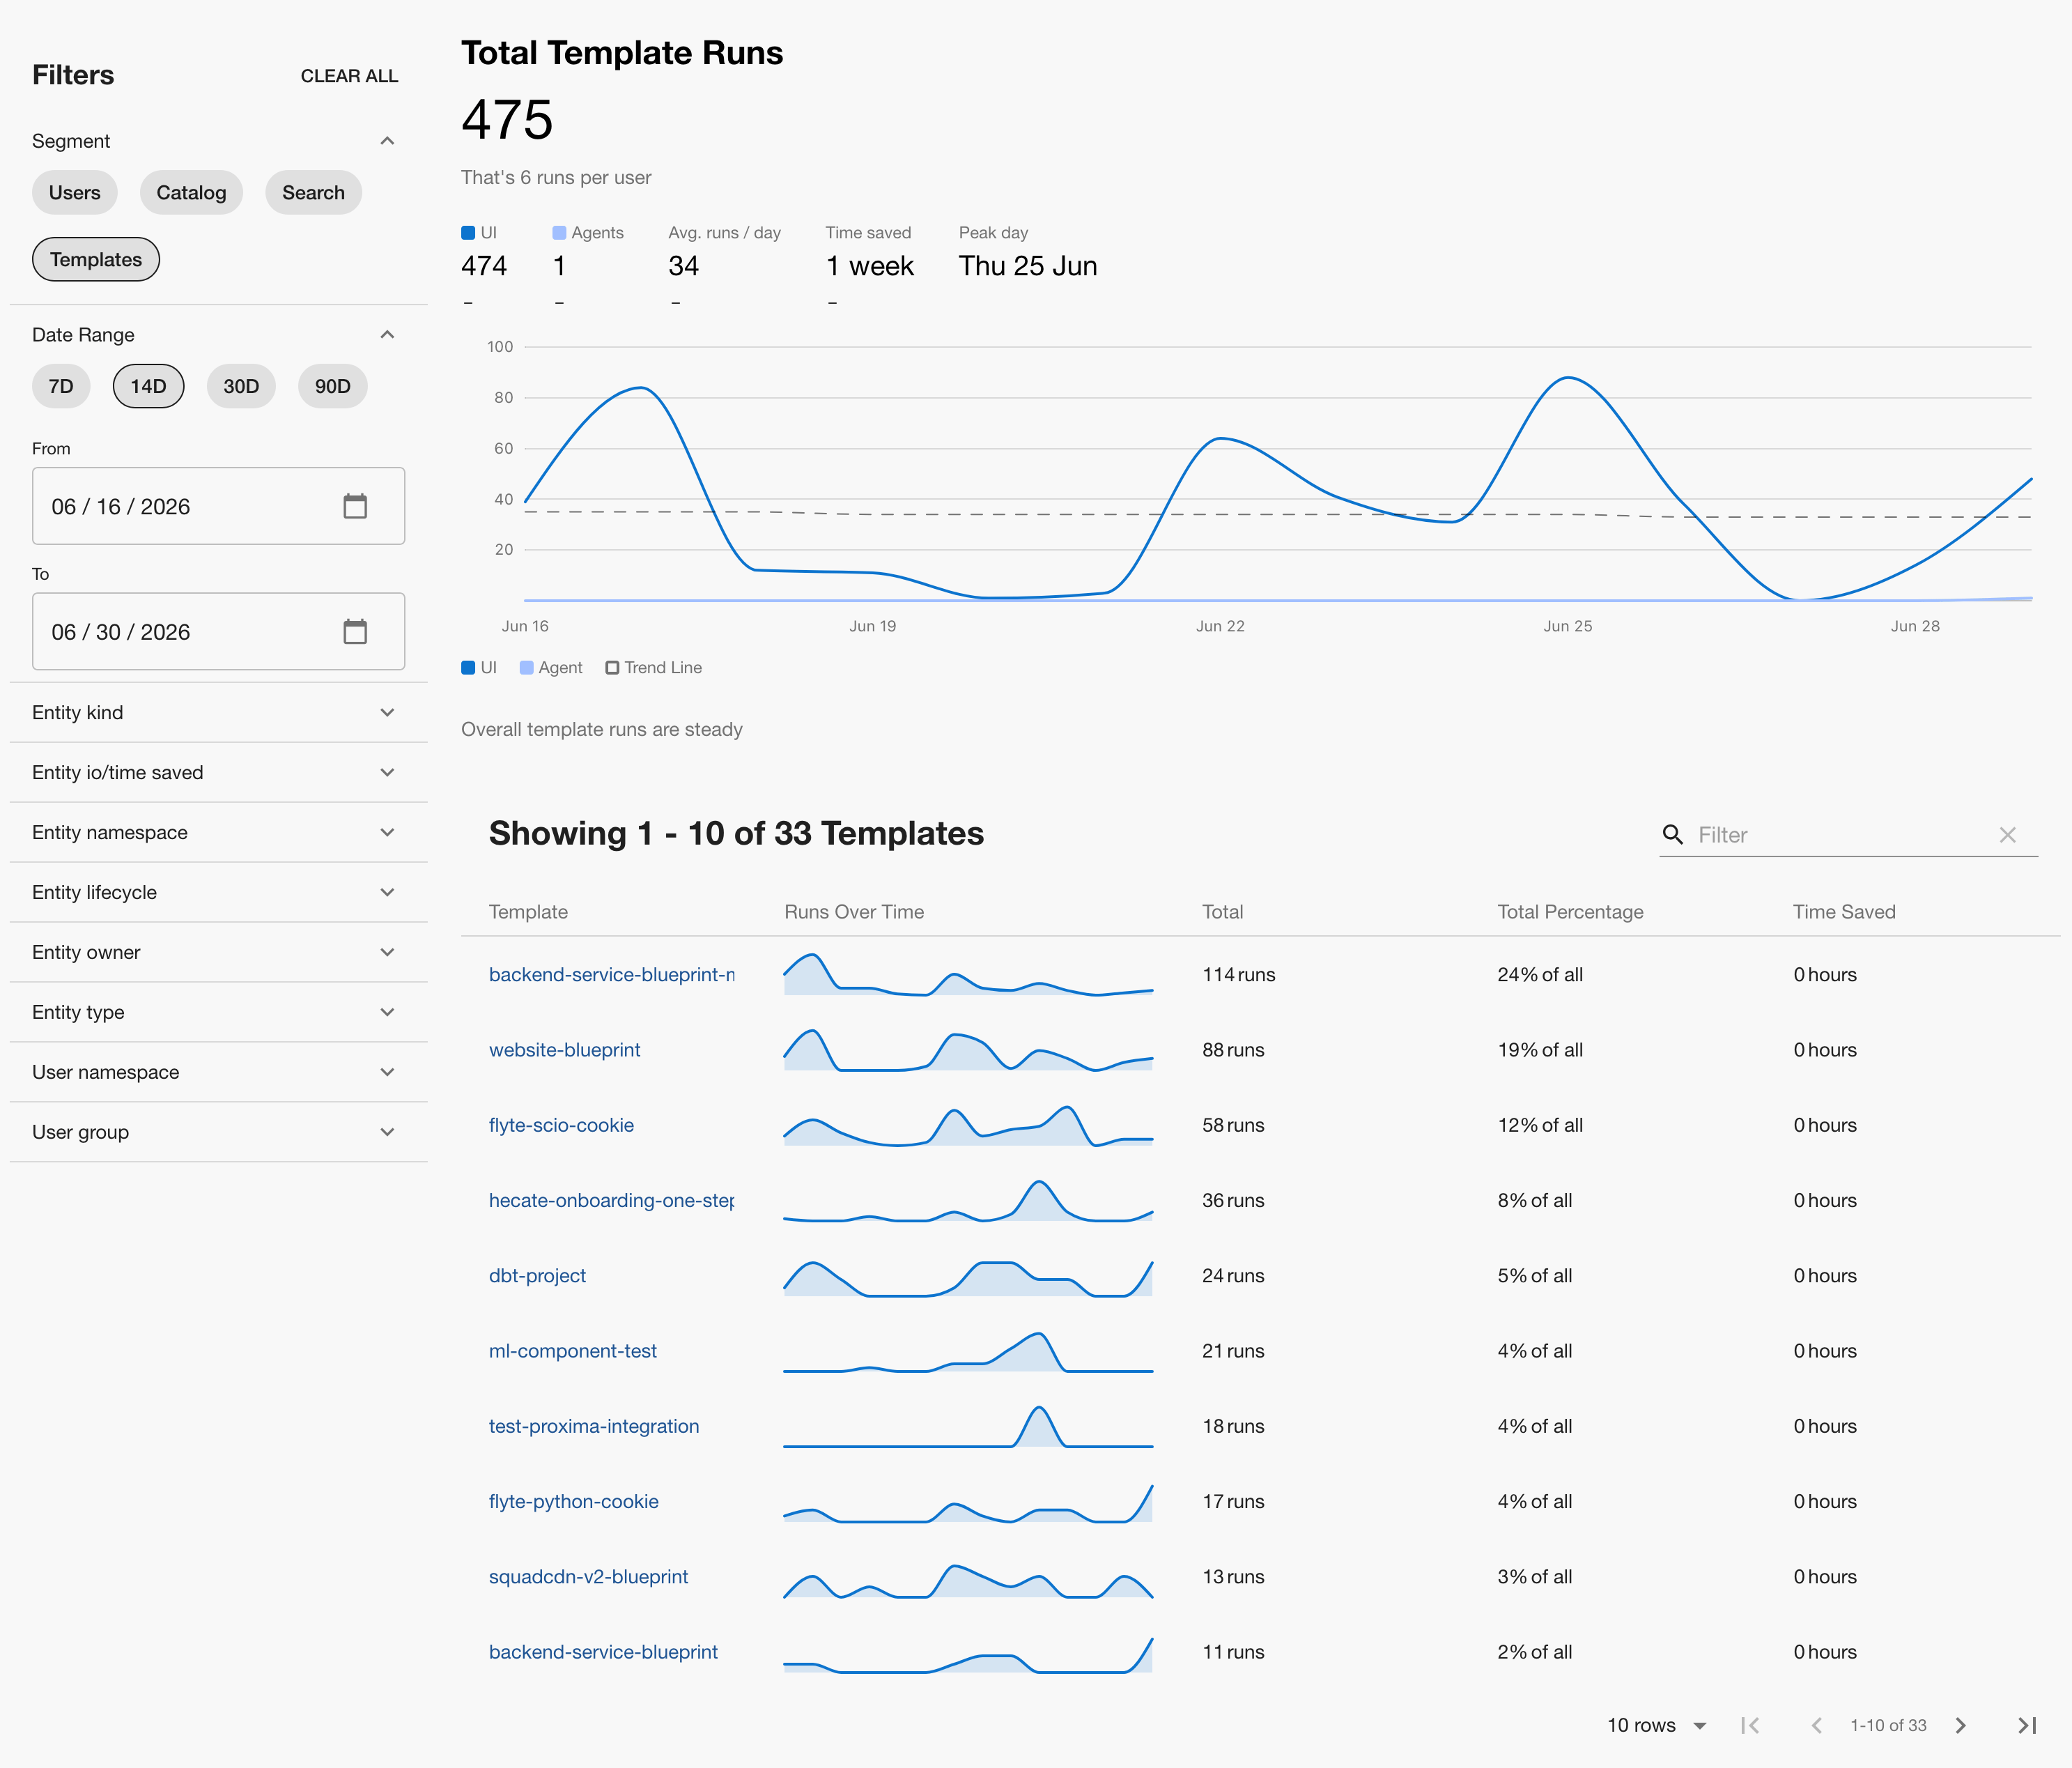
Use Cases
- Template Usage Analysis: Assess the adoption and popularity of specific templates by tracking overall usage.
- Comparative Usage Evaluation: Evaluate the usage of different templates to identify the most relied-upon ones.
- Template Optimization: Optimize templates based on usage data to meet user needs effectively.
Export Data
This functionality is experimental and rolled out to most customers. If you
have feedback, please feel free to reach out to us.
Export Data button. Use this to export the events log for a selected calendar month in CSV format.
The exported CSV file will contain the following columns:
event_id: A unique identifier for a particular action takentimestamp: An ISO 8601 datetime (in UTC) representing when the action was takenuser_id: A hashed representation of the user who took the actionhost: The hostname of the Backstage instance where the action was taken (note: exports respect thebackstageInsights.hostFilterconfigured inapp-config.yaml)plugin_id: The plugin where the action was takenaction: The action taken (e.g.navigate,click,search)subject: A secondary level of detail related to the action (e.g. a page path fornavigateactions)context: A JSON object containing additional context related to the action takenattributes: A JSON object containing additional attributes for the action taken