
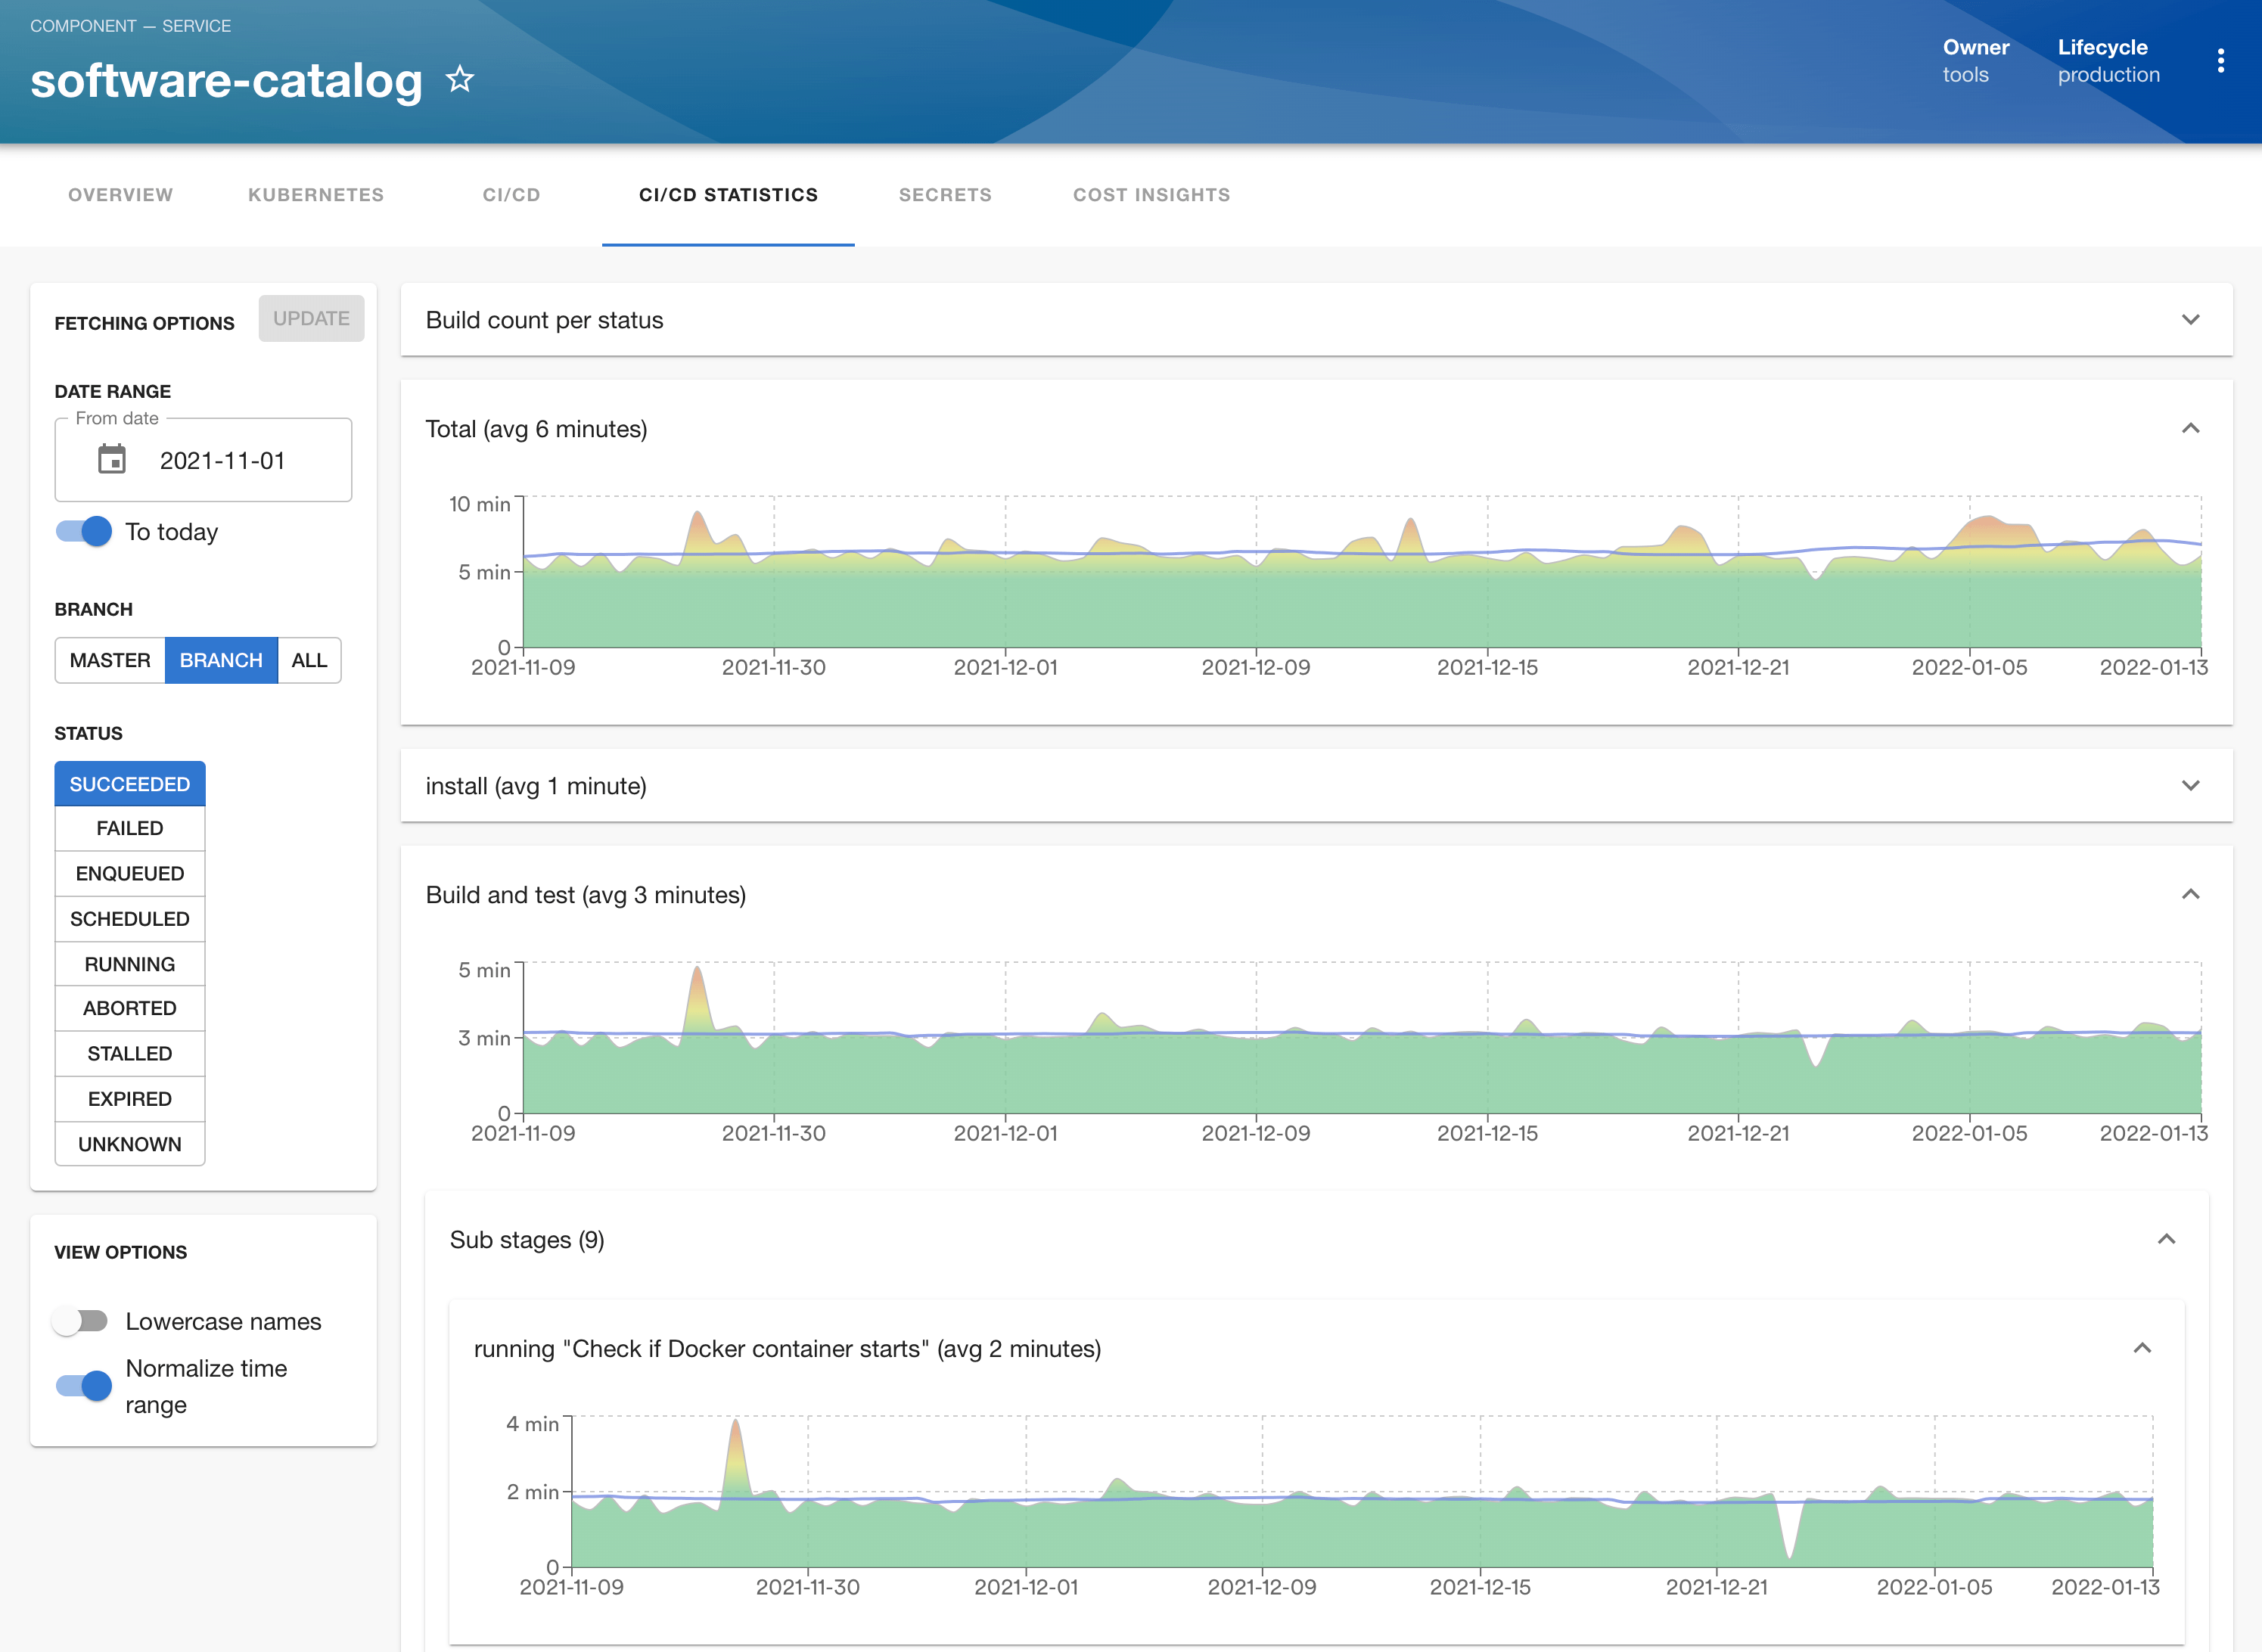
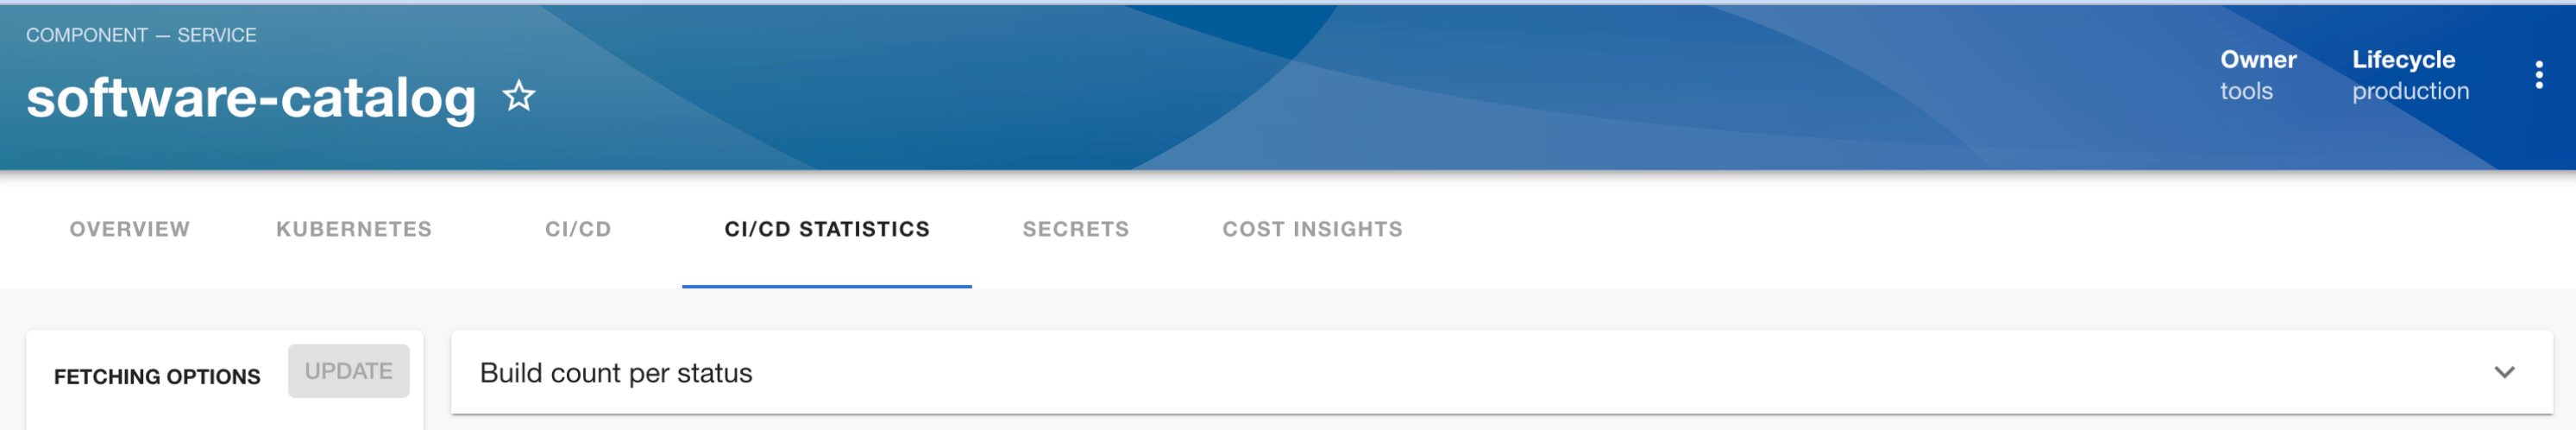
CI/CD Statistics
Effortlessly track and visualize CI/CD pipeline statistics such as build time or success and error rates
Developer
Spotify
Category
CI/CD
About the plugin
Built by Spotify, the CI/CD Statistics plugin is a specialized tool designed for the Software Catalog entity page to track and visualize pipeline stats like build time, success rates, and error rates.
Increase precision
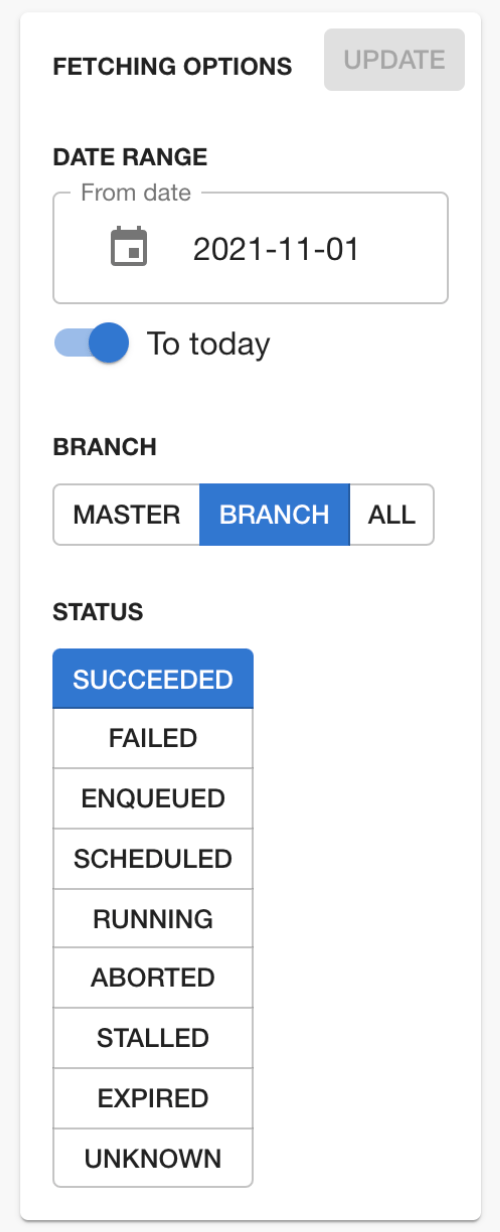
With the useEntity function, the CI/CD Statistics plugin guarantees precise build information, eliminating any guesswork and ensuring the data represents the exact component you're analyzing.
Dive deep into CI/CD processes
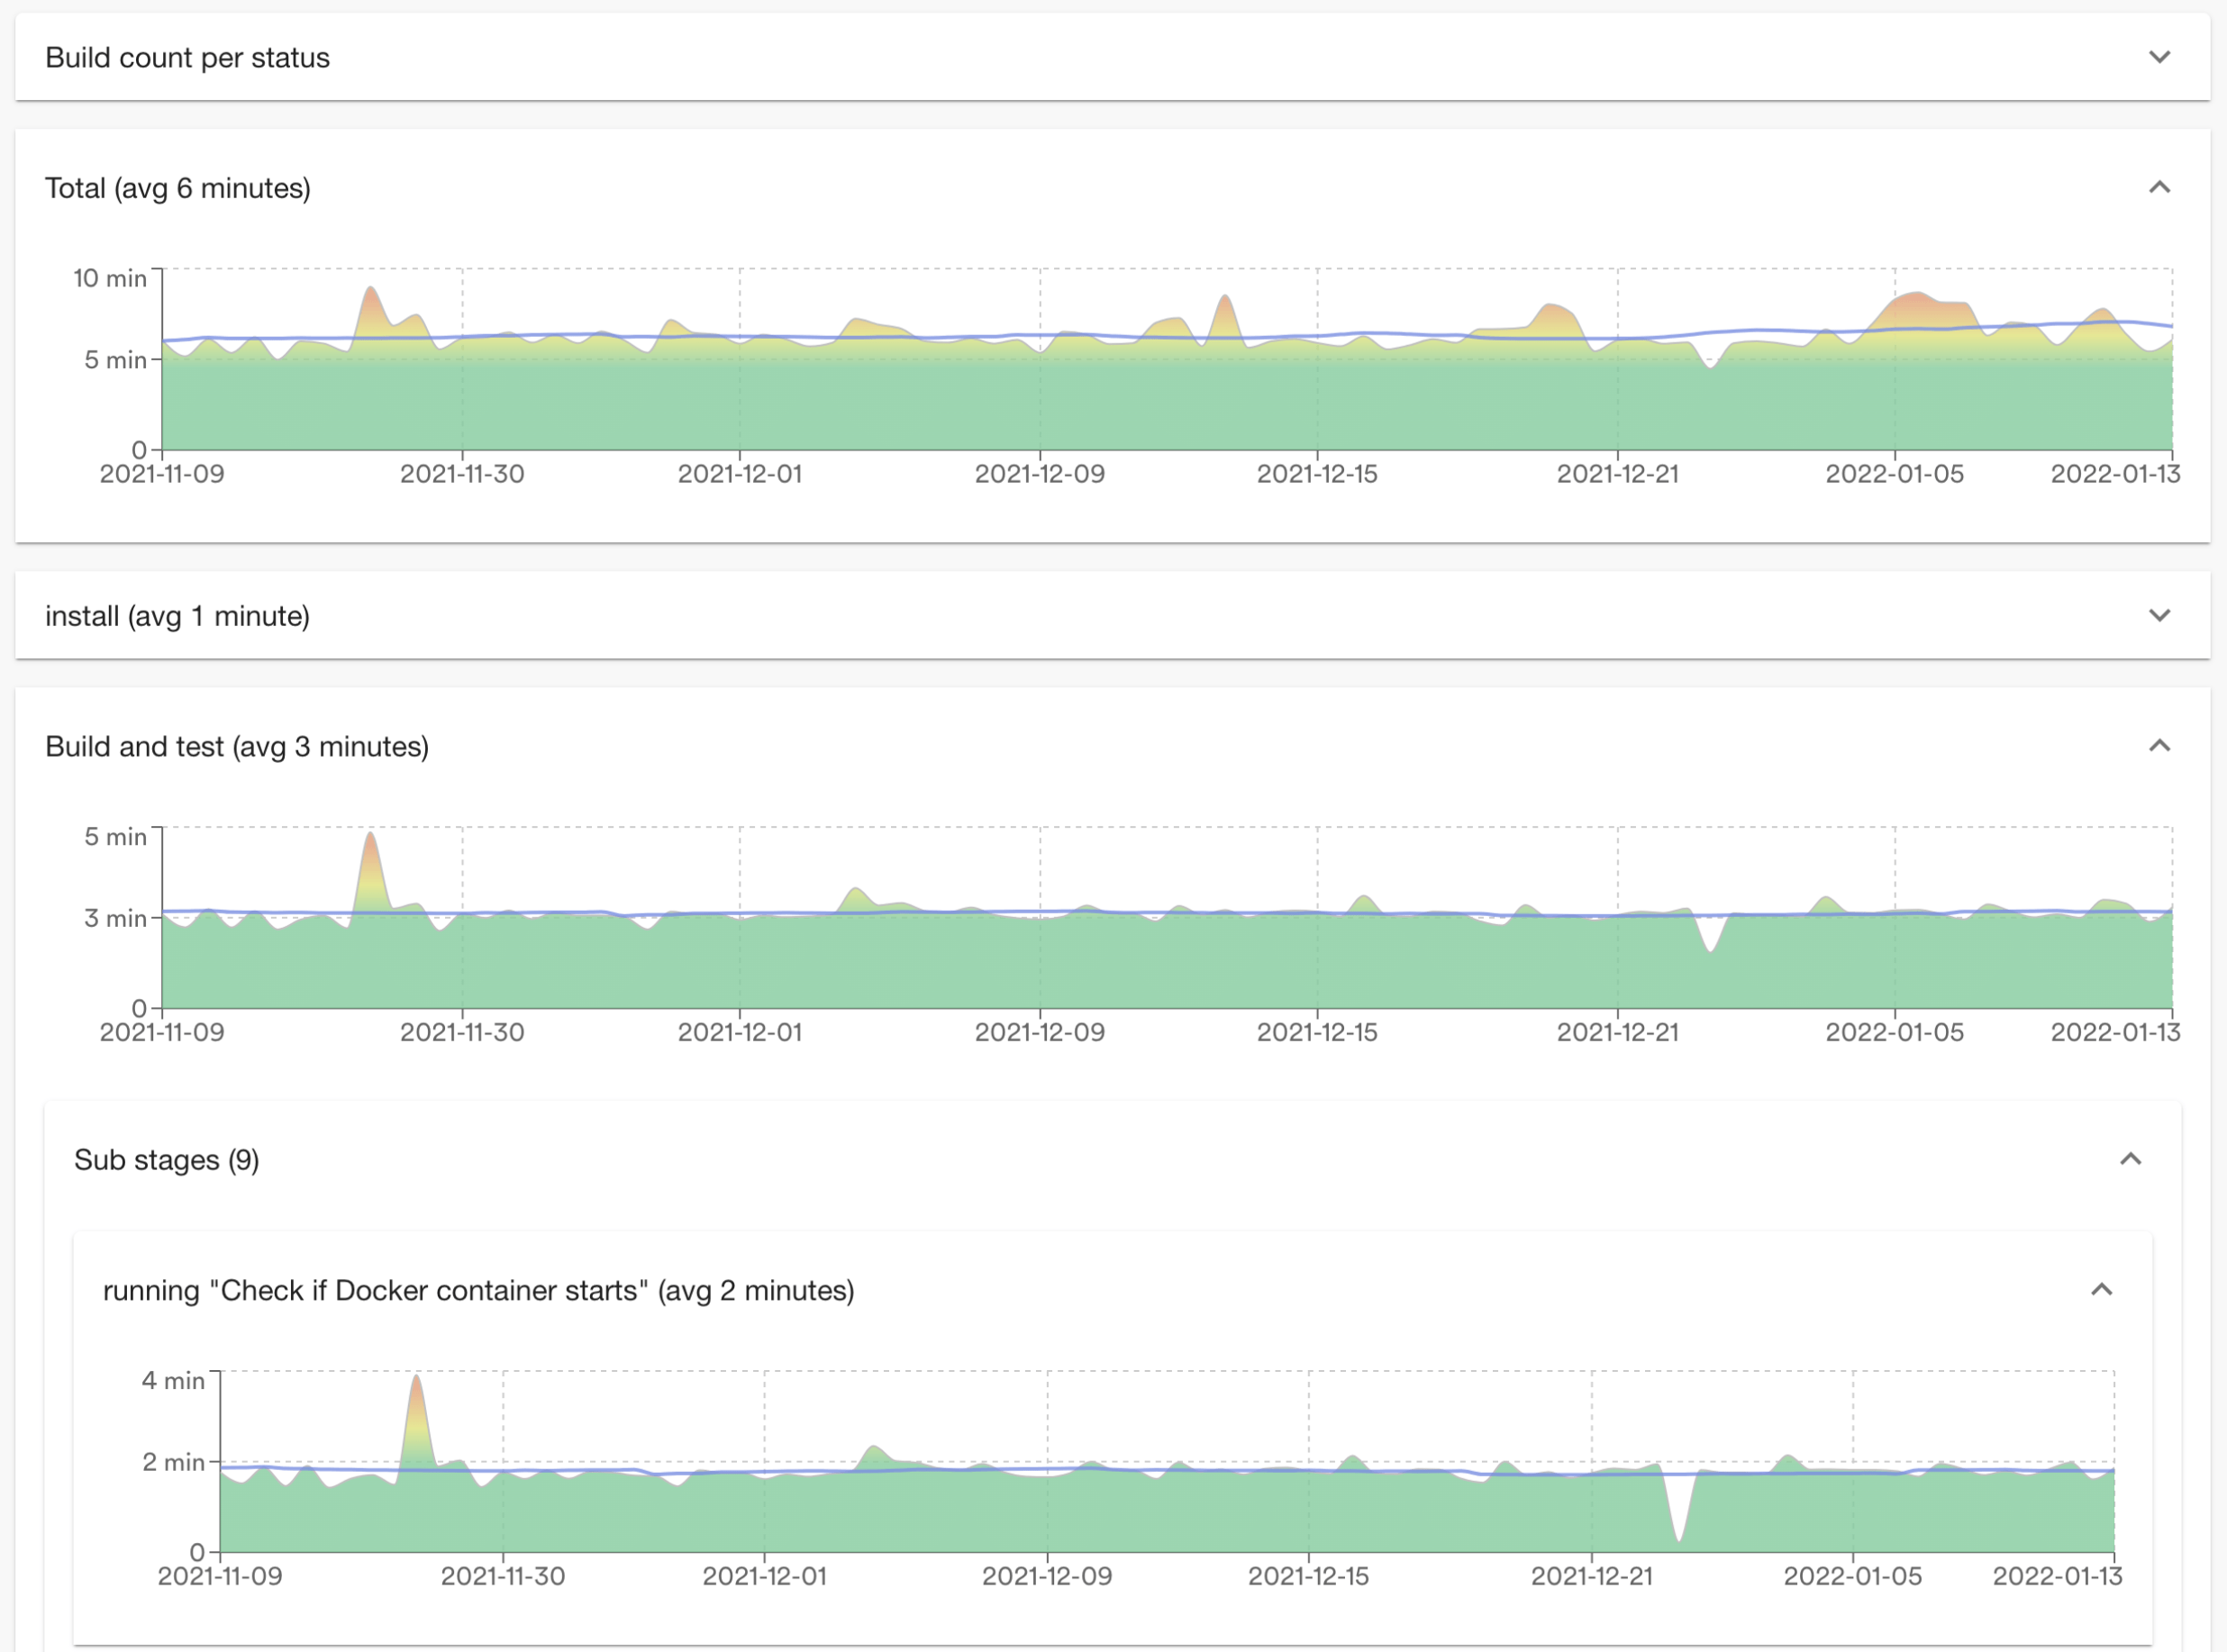
Get a clearer view into your CI/CD processes with detailed charts showcasing pipeline durations to identify trends, help pinpoint bottlenecks, and optimize workflows.
CI/CD Statistics features
CI/CD build visualization
Display charts illustrating CI/CD pipeline durations over specified periods, helping teams assess build performance trends easily.
Success/error rate metrics
Get clear insight into build success and error rates, making it easier to understand deployment process reliability.
Integration with Software Catalog
Designed to seamlessly function on the Backstage Software Catalog entity page, extracting data based on the component selected via the useEntity method.
Additional information
CI/CD Statistics
Effortlessly track and visualize CI/CD pipeline statistics such as build time or success and error rates