Insights
Analyze Backstage usage and sentiment data from your developers to drive Backstage adoption
Developer
Spotify
Category
Monitoring
About the plugin
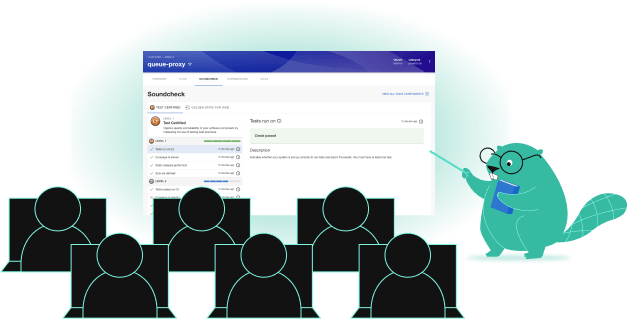
The Insights plugin provides a comprehensive window into Backstage usage and sentiment at your organization. As a Backstage champion, this data helps you understand how developers are using Backstage, where the best opportunities are to improve their experience, and how that experience is evolving over time.
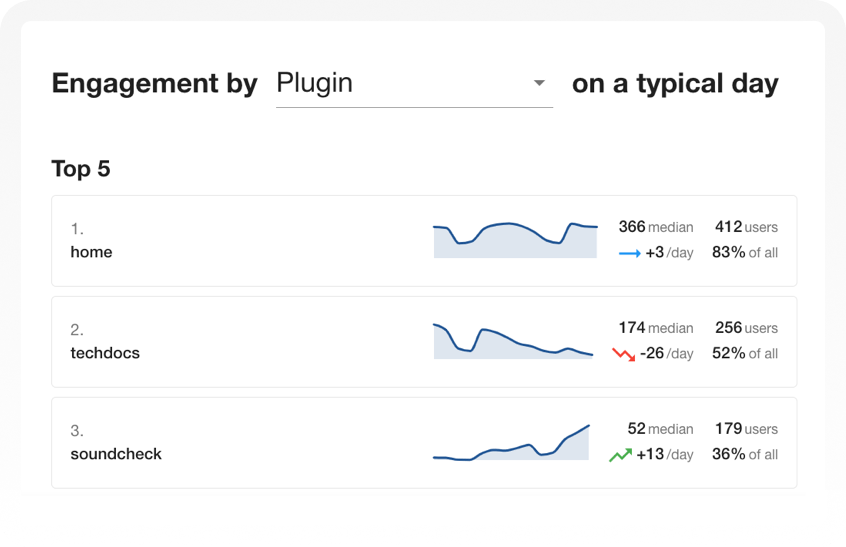
Measure user and plugin adoption
Understand how users are adopting Backstage at your organization with overall and plugin-specific engagement metrics. Use this data to validate the success of your Backstage instance and identify areas where you can maximize your impact.
Understand user behavior and sentiment
Dive deep into all kinds of data about how users are using Backstage, including sentiment data from short pop-up surveys you can run all across the Backstage platform. Insights provides a comprehensive view of how Backstage users are actually interacting with your Backstage app. The plugin captures user, search, catalog, and template activities within your organization, eliminating the need for manual setup. Use this data to gain a deep understanding of user behavior and evaluate the success of your Backstage initiatives.
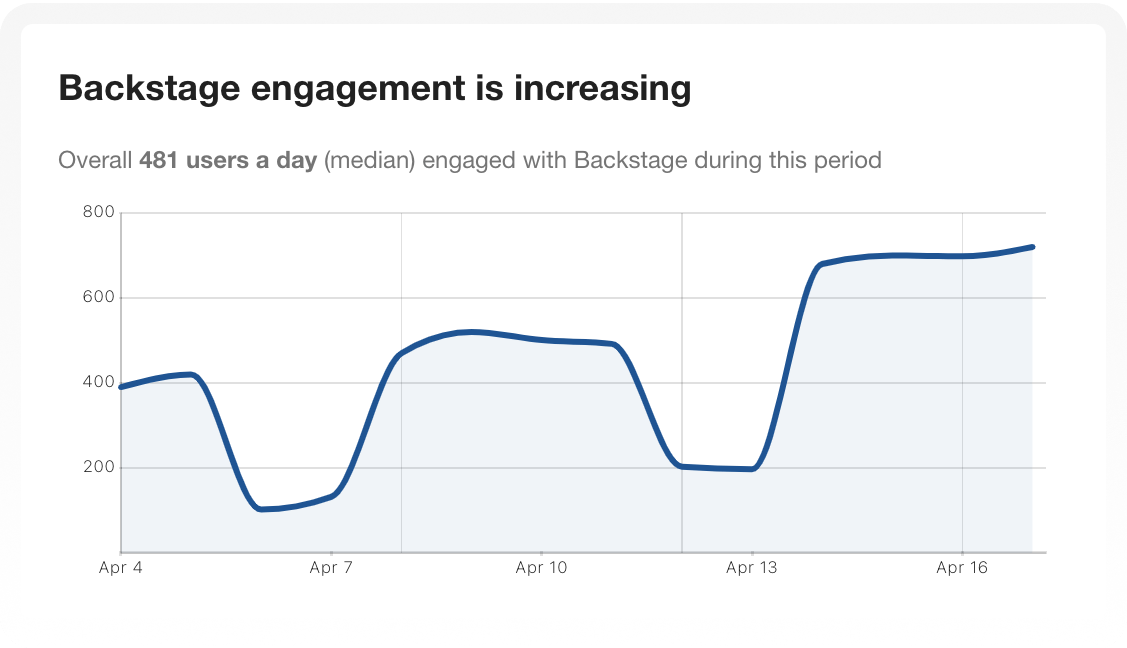
Identify trends
Understand how your Backstage experience is changing over time. Insights highlights the most important trends for Backstage champions with pre-built graphs that allow you to benchmark and compare user behavior data over time. It also provides the flexibility you need to explore the data yourself based on your organization's priorities.
Insights features
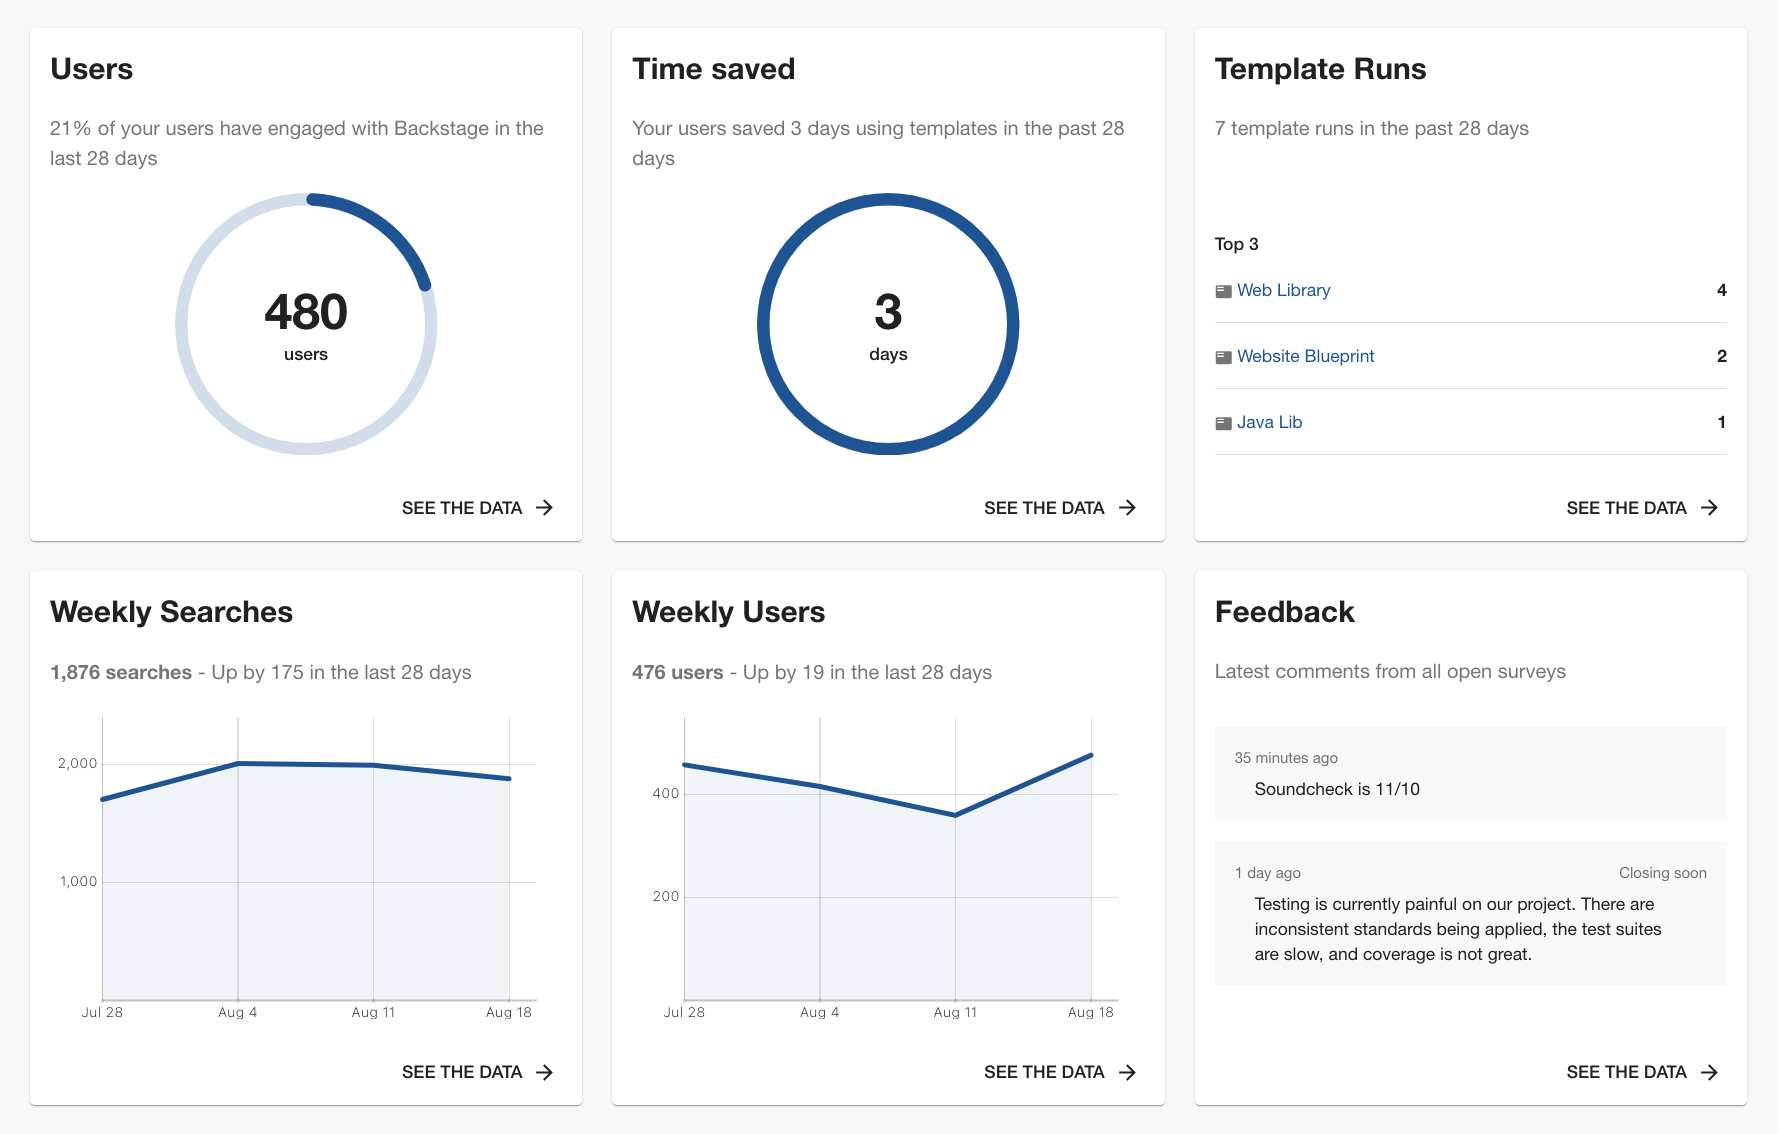
Headlines
Easily identify the most important metrics and trends related to your Backstage instance. Insights surfaces headline metrics like user activation, feedback from recent surveys, and Scaffolder template usage over time. As a Backstage champion, this is your dashboard to quickly understand the success of your organization's Backstage rollout and to identify where there are opportunities for improvement.
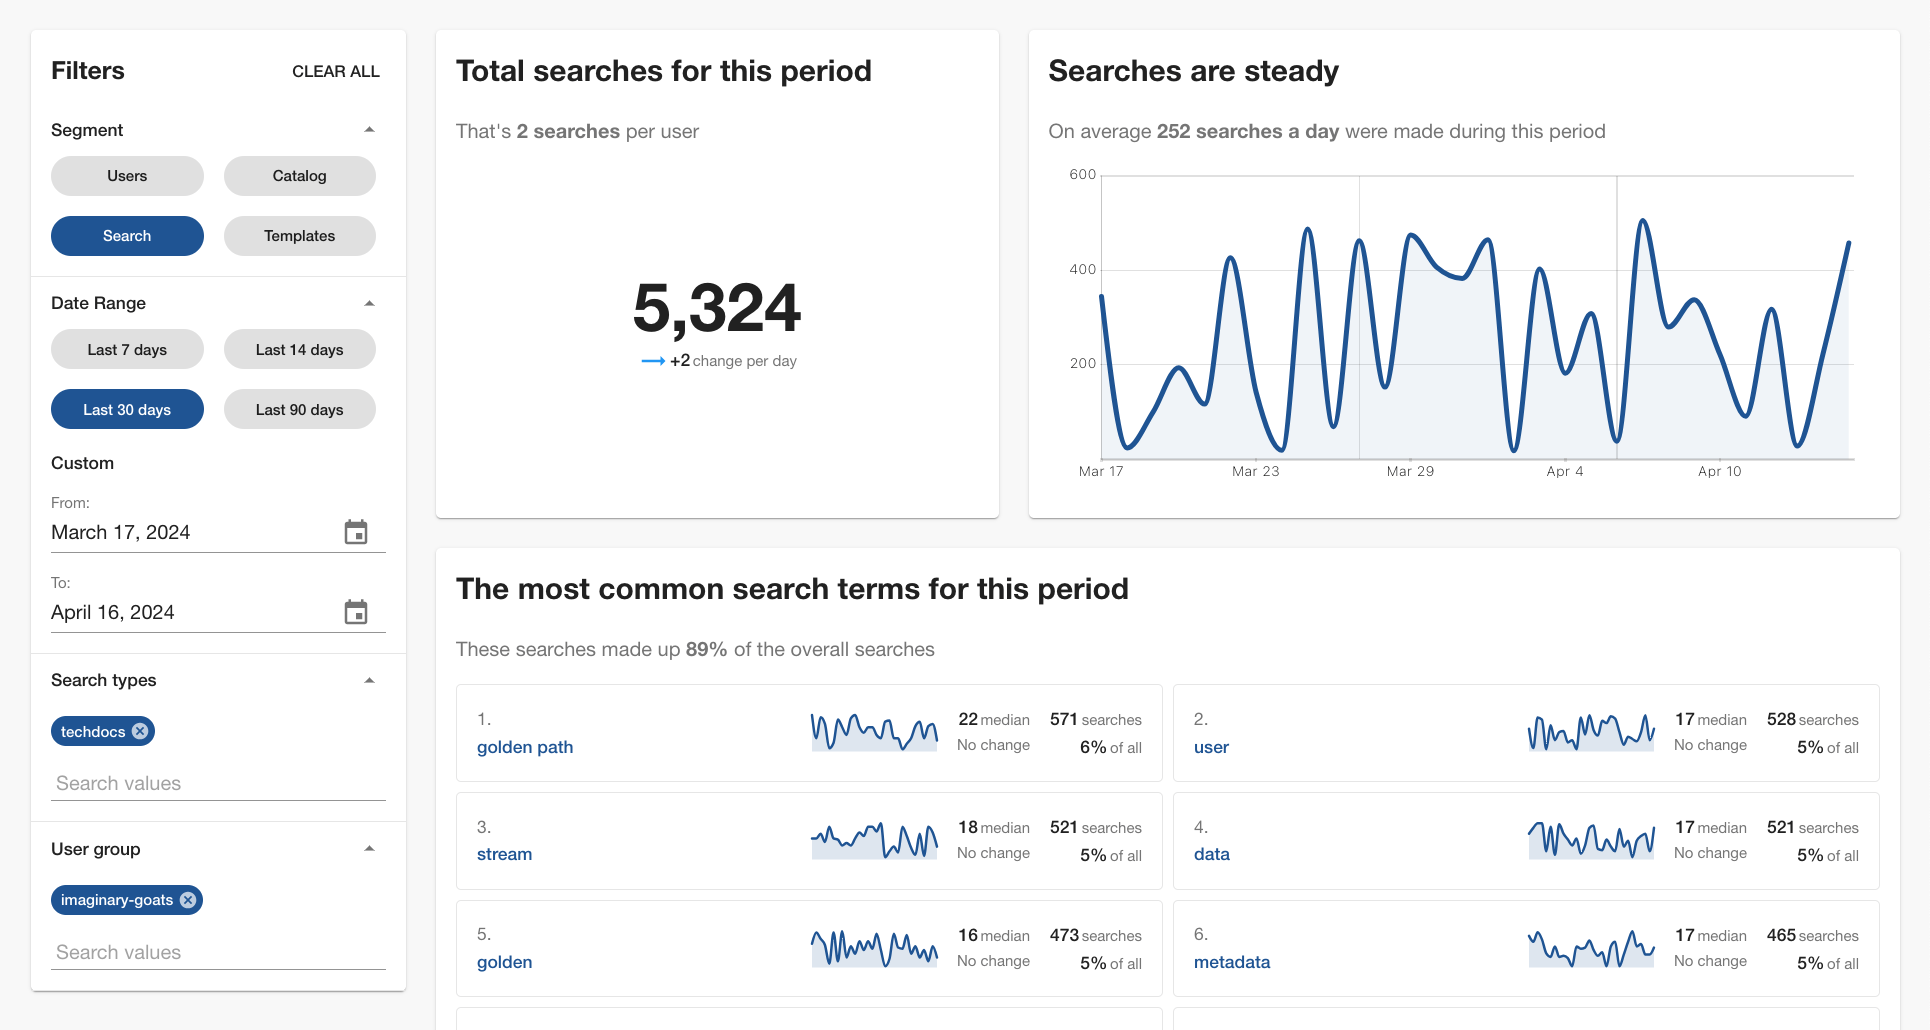
Usage
Want to dive deeper into your Backstage usage data? Insights makes it easy to explore all kinds of data about how your users are engaging with Backstage. Filters allow you to refine your search based on specific criteria, and prebuilt graphs help you understand trends over time.
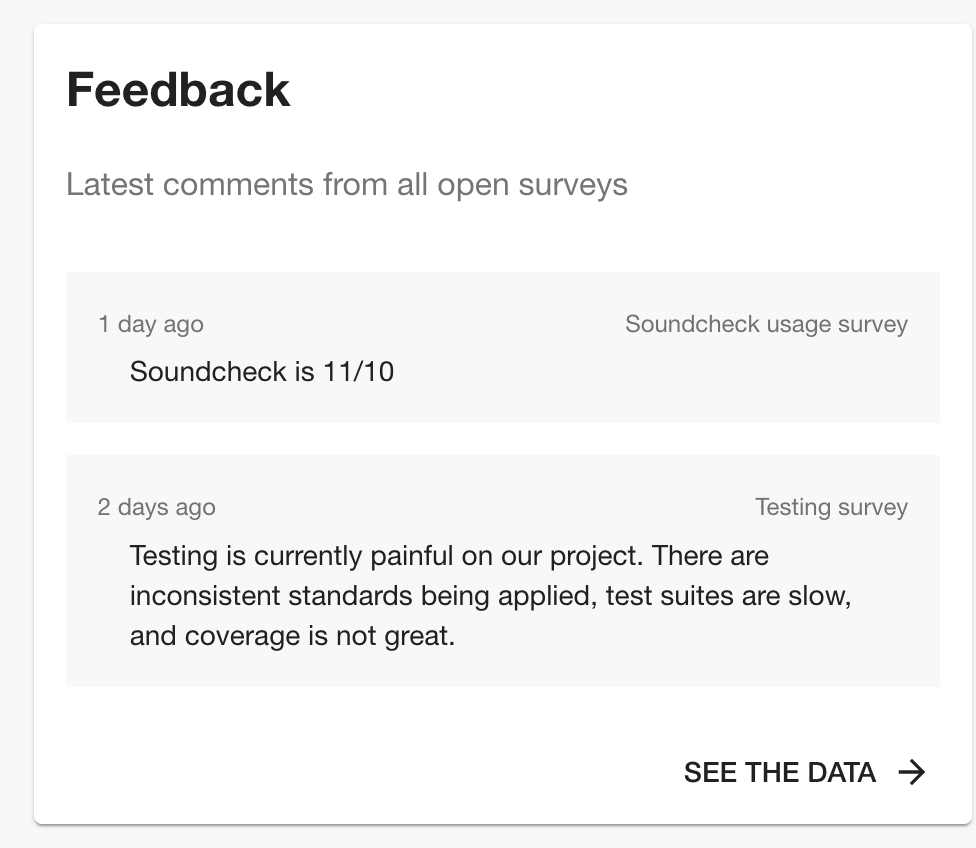
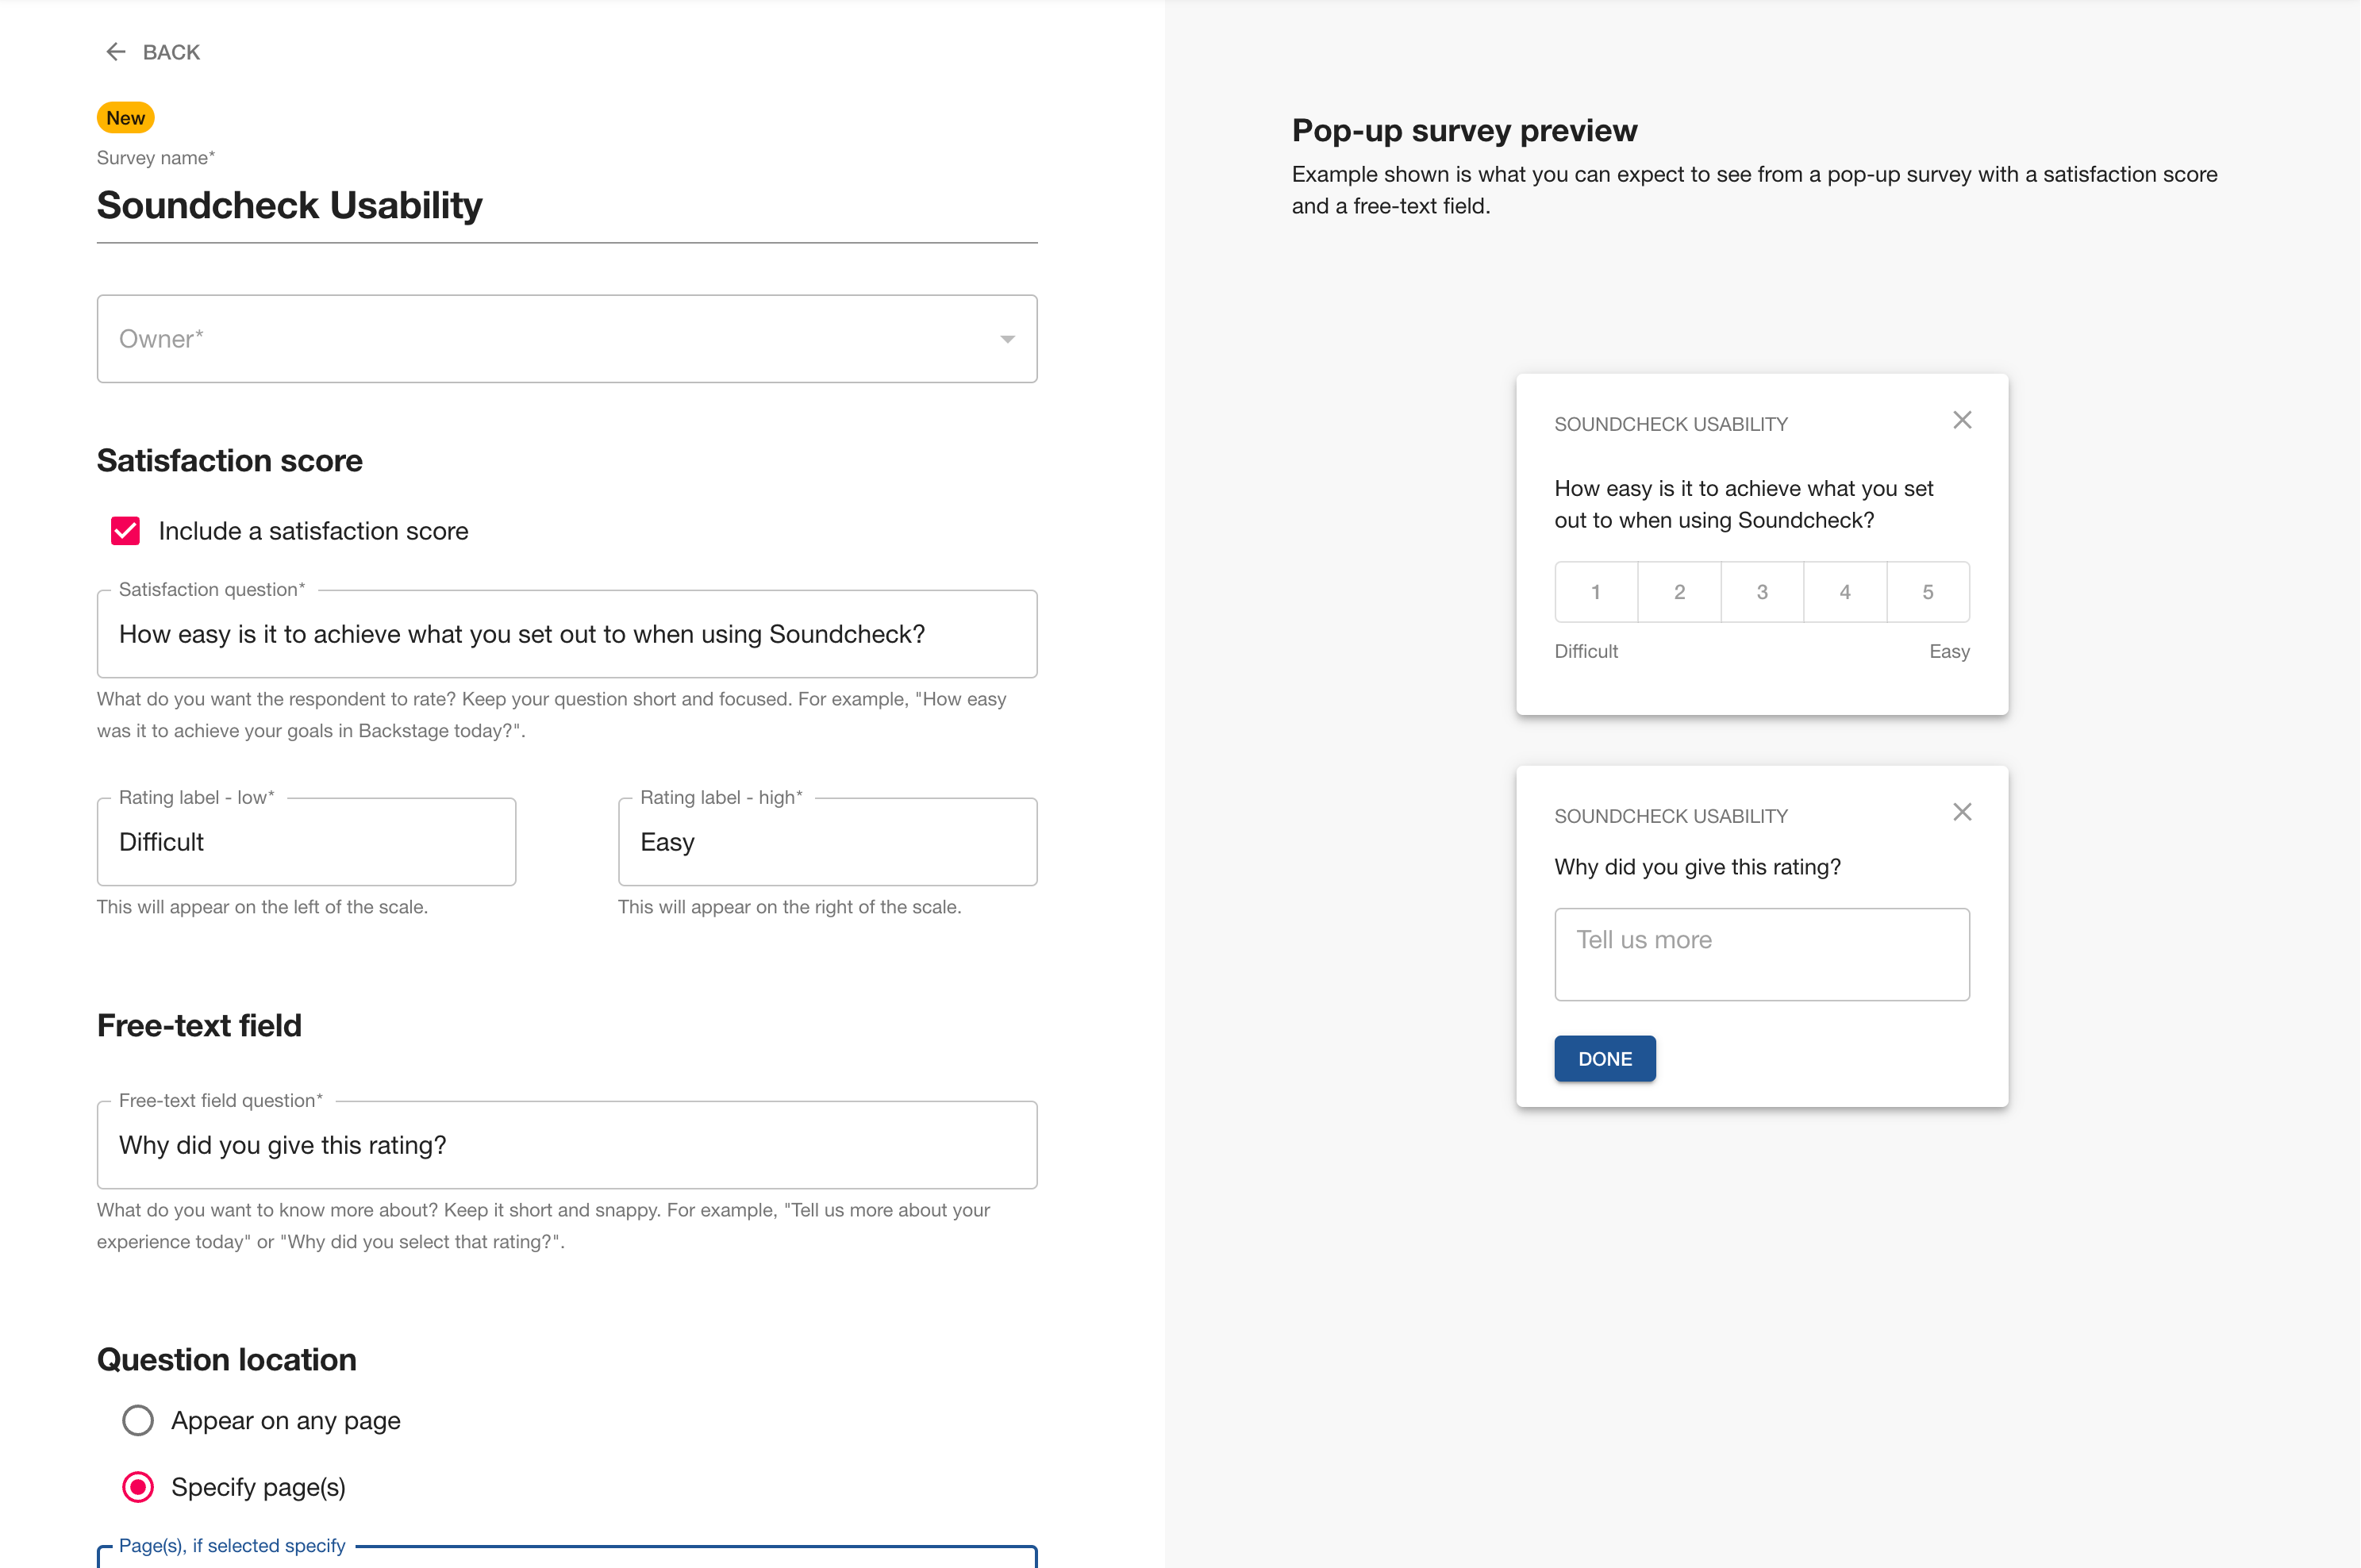
Feedback
Easily collect user feedback about plugins or specific pages in Backstage with short pop-up surveys. As a Backstage champion, you can create surveys with custom questions to identify how users feel about Backstage. View this data alongside your usage data to get a full picture of how your organization is using Backstage and where there are opportunities for improvement.
Additional information
Book a demo
Still have questions about Insights? No problem, just join one of our weekly demos hosted by a Spotify expert.