topology icon

Application Topology for Kubernetes

Visualize real-time status and relationships of application and infrastructure workloads deployed to Kubernetes

Developer

Red Hat

Category

Infrastructure

Backstage entity view with a selected tab "topology". There is a graph of pods and their dependencies. There is a single pod in this graph, selecting it opens a modal. That modal has two tabs, "details" and "resources". The "details" tab is selected and has the following information for that pod: "name", "status", "namespace", "update strategy", "labels", "max unavailable", "max surge", "progress deadline seconds", "annotations", and "min ready seconds" details shown.

About the plugin

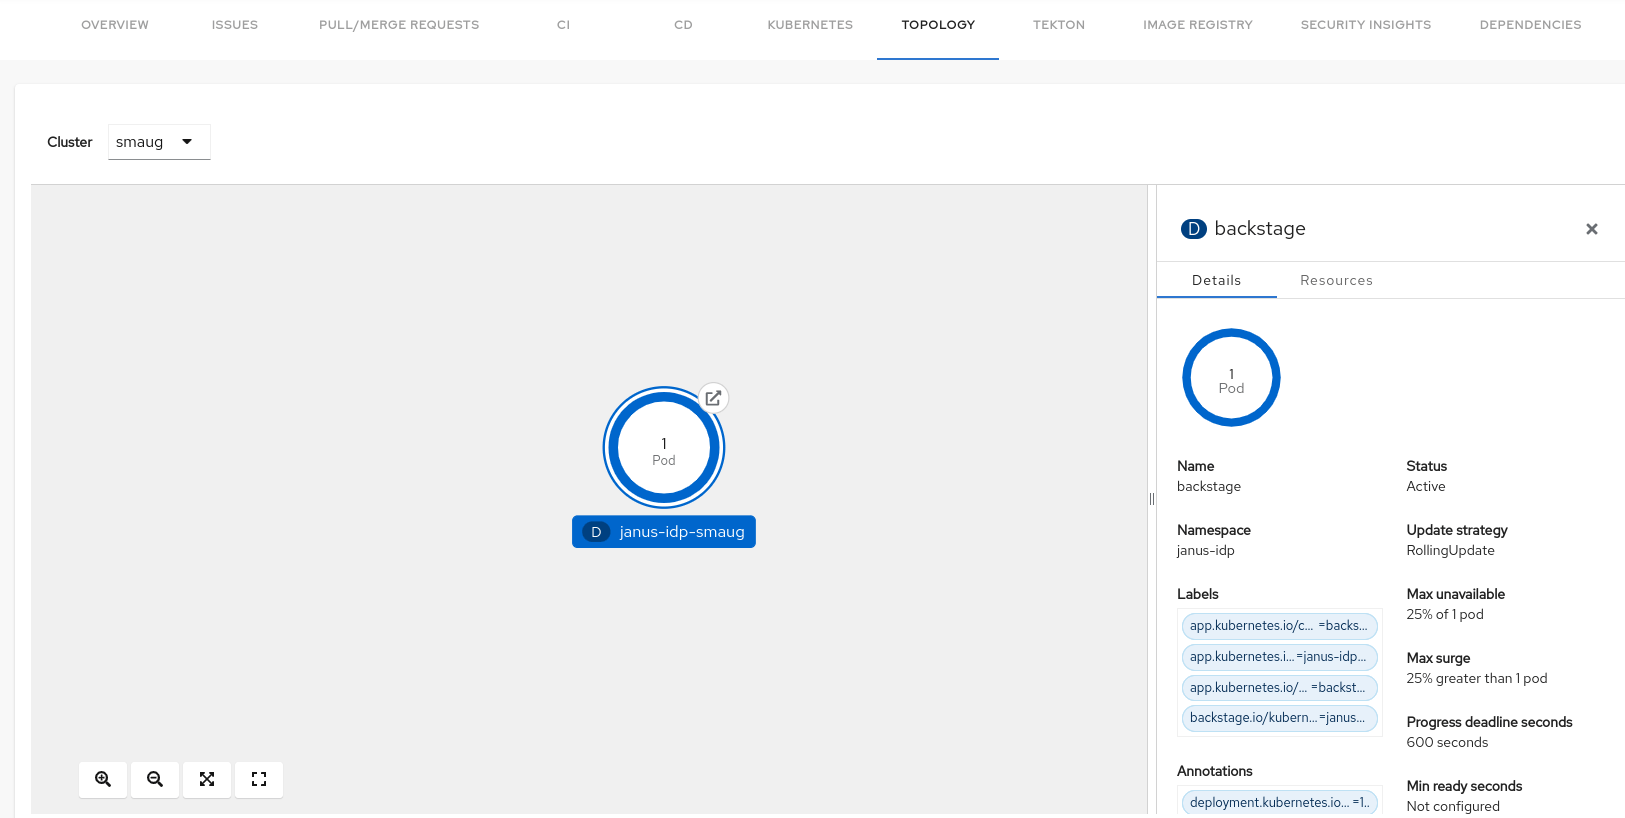
The Topology plugin enables you to visualize real-time statuses and relationships of application and infrastructure workloads such as Deployment, Job, Daemonset, Statefulset, CronJob, and Pods powering any service on the Kubernetes clusters, including Red Hat OpenShift, in a consistent manner.

  • Visually understand applications and topology

  • Quick access to all relevant information

  • Assess status and counts in seconds

Application Topology for Kubernetes features

Detailed view into your infrastructure

View a unified real-time status of applications and infrastructure as well as the resources and deployments within your apps. Directly access associated ingress.

Backstage entity view with a selected tab "topology". There is a graph of pods and their dependencies. There is a single pod in this graph, selecting it opens a modal. That modal has two tabs, "details" and "resources". The "details" tab is selected and has the following information for that pod: "name", "status", "namespace", "update strategy", "labels", "max unavailable", "max surge", "progress deadline seconds", "annotations", and "min ready seconds" details shown.

Application Topology for Kubernetes

Visualize real-time status and relationships of application and infrastructure workloads deployed to Kubernetes

Backstage entity view with a selected tab "topology". There is a graph of pods and their dependencies. There is a single pod in this graph, selecting it opens a modal. That modal has two tabs, "details" and "resources". The "details" tab is selected and has the following information for that pod: "name", "status", "namespace", "update strategy", "labels", "max unavailable", "max surge", "progress deadline seconds", "annotations", and "min ready seconds" details shown.