kiali icon

Kiali Service Mesh

Configure, visualize, validate and troubleshoot your mesh with Istio

Developer

Red Hat

Category

Monitoring

A tab labeled "KIALI" in an example Backstage component entity page. In that page, there is information about the service mesh of a system called "istio-system". There are graphs showing memory and CPU usage over the late 10 minutes. Selectors at the top of the section allow you to select 1. a new type of health check, labelled "Health for", 2. which direction to consider traffic, inbound or outbound, and 3. when to show metrics from, 10 minutes, 30 minutes, etc.

About the plugin

The Kiali plugin exposes information about your entity-specific ServiceMesh objects. A separate Kiali tab displays the overview view associated with a Servicemesh.

  • Coherent and integrated visibility into the Service Mesh

  • Health, metrics and warnings centrally and conveniently located

Kiali Service Mesh features
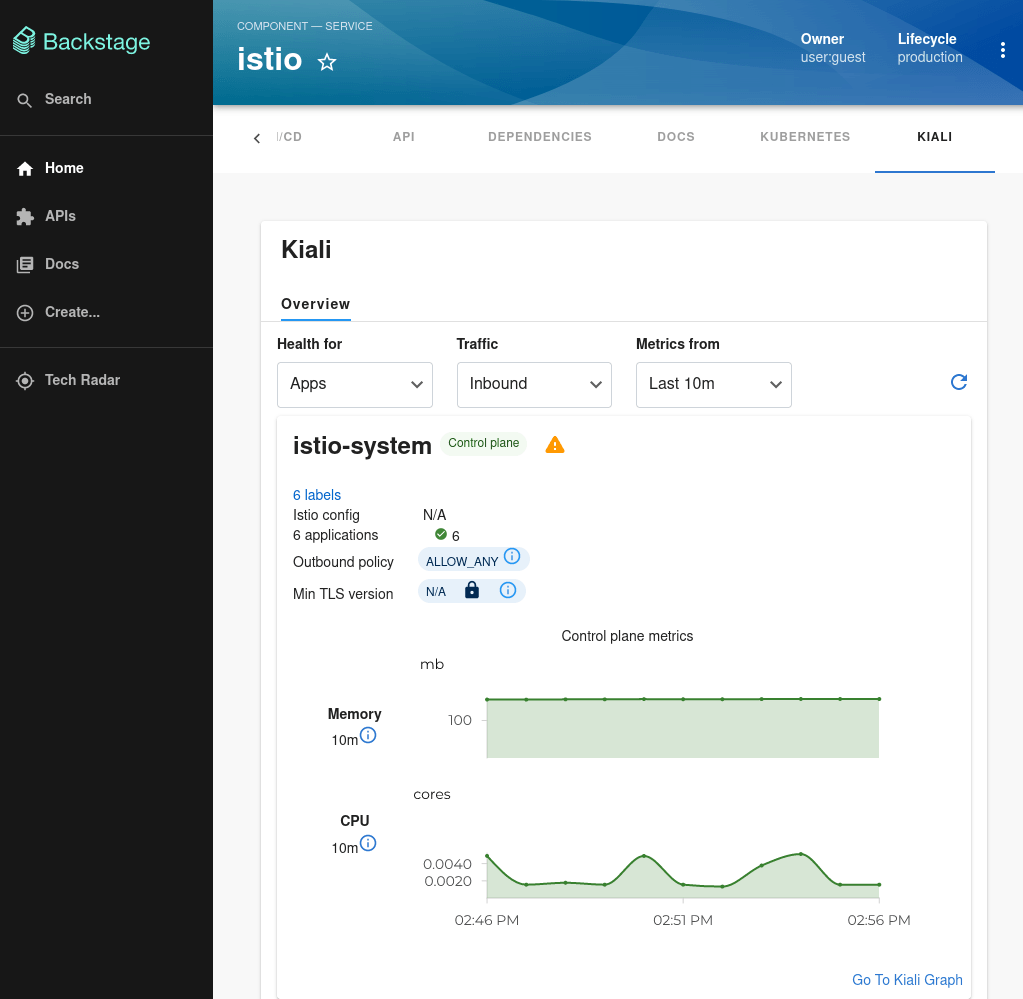
Overview page

On the overview page, you can see an overview of metrics and health by namespace, look at canary information, and see Istio config warnings.

A tab labeled "KIALI" in an example Backstage component entity page. In that page, there is information about the service mesh of a system called "istio-system". There are graphs showing memory and CPU usage over the late 10 minutes. Selectors at the top of the section allow you to select 1. a new type of health check, labelled "Health for", 2. which direction to consider traffic, inbound or outbound, and 3. when to show metrics from, 10 minutes, 30 minutes, etc.

Kiali Service Mesh

Configure, visualize, validate and troubleshoot your mesh with Istio

A tab labeled "KIALI" in an example Backstage component entity page. In that page, there is information about the service mesh of a system called "istio-system". There are graphs showing memory and CPU usage over the late 10 minutes. Selectors at the top of the section allow you to select 1. a new type of health check, labelled "Health for", 2. which direction to consider traffic, inbound or outbound, and 3. when to show metrics from, 10 minutes, 30 minutes, etc.