DX
Enhance your Backstage instance with DORA metrics, developer experience scores, service insights, and more
Developer
DX
Category
Monitoring
About the plugin
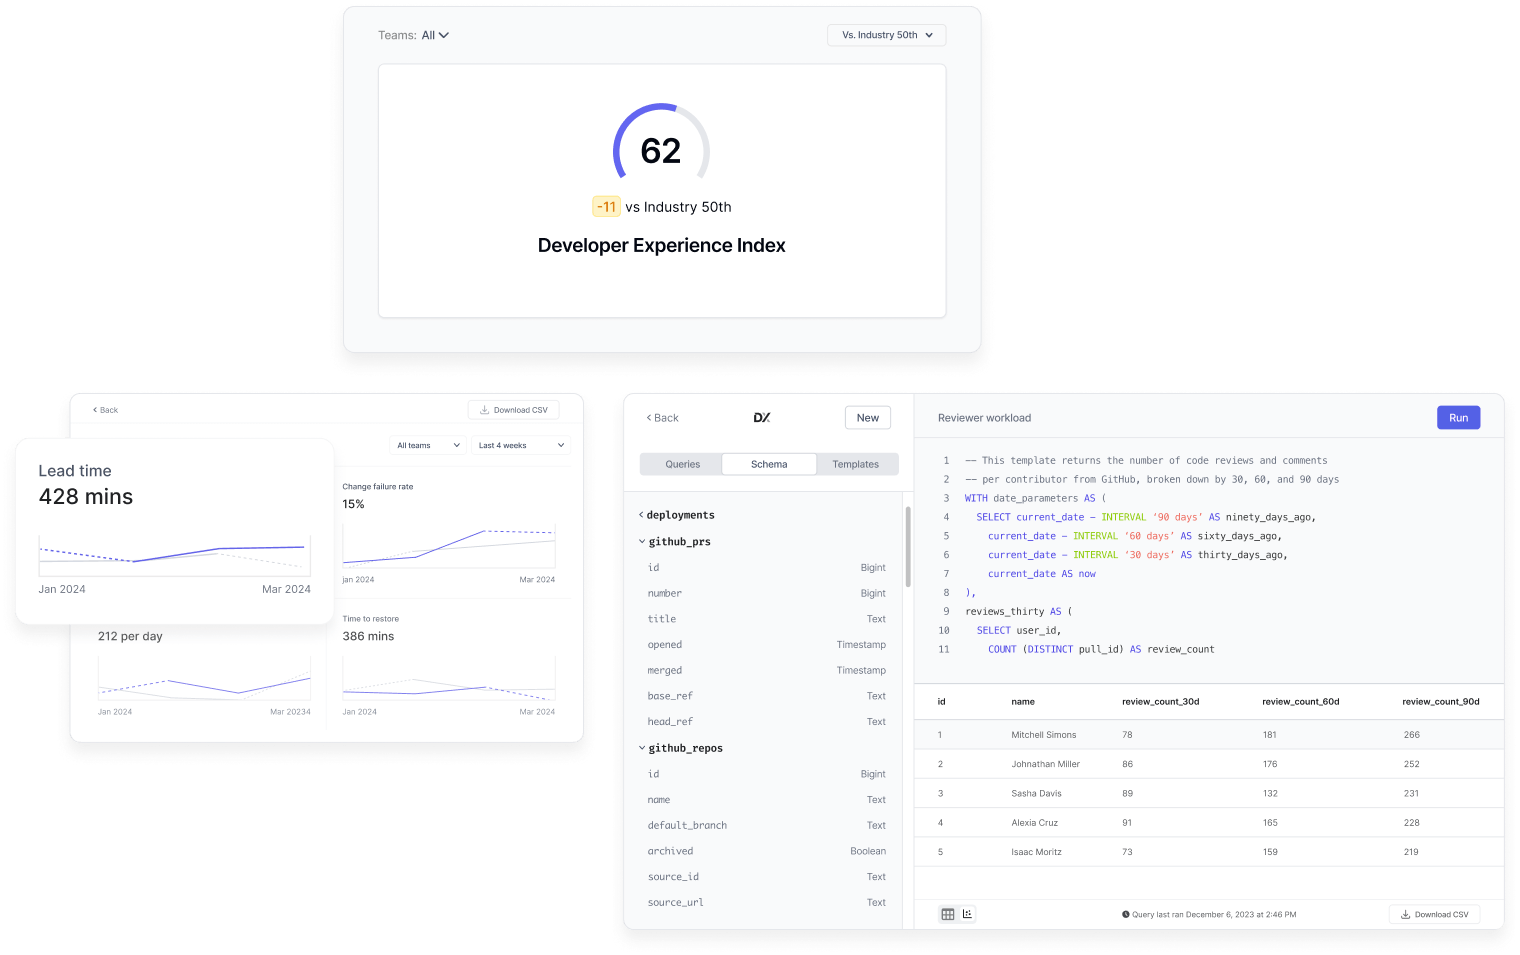
Skip the hassle of building your own analytics database. DX aggregates data about your services and teams, making it easy to provide metrics and insights within Backstage, including DORA metrics, service insights, developer experience scores, and more.
Save months of engineering effort
Build metrics and insights into Backstage in minutes, not months. DX provides dozens of data connectors and APIs to aggregate your SDLC data and quickly stand up the back-end needed to power your Backstage instance.
Enrich your Backstage experience
Use prebuilt React components to quickly add valuable insights to your developer portal including DORA metrics, service maintainers, developer experience insights, and more. DX components are 100% open-source, letting you contribute and benefit from the community.
Built for enterprise
Your DX instance is fully isolated and single-tenant with on-prem deployment options, enabling you to meet even the most stringent performance and security needs.
DX features
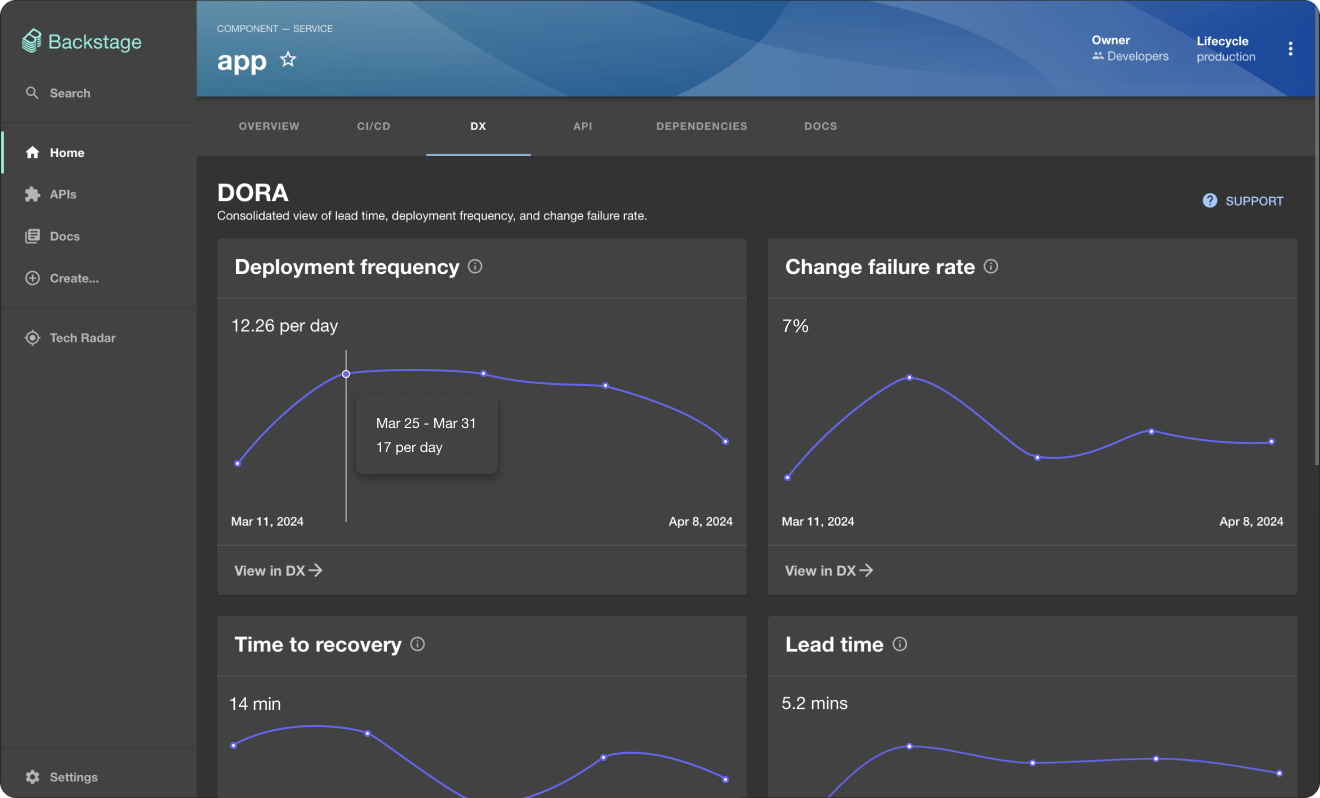
DORA metrics
Provide DORA metrics for Backstage components and groups, giving teams a quick understanding of system health and performance.
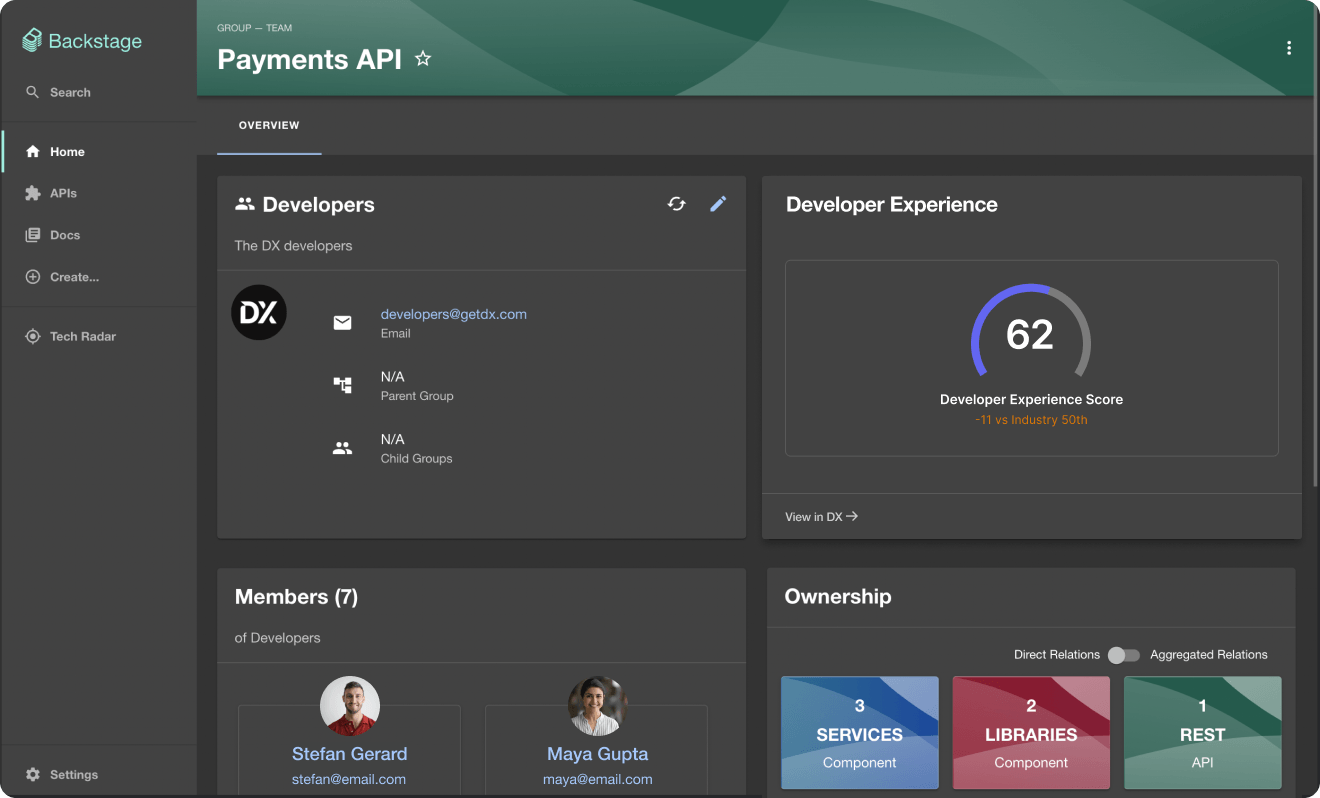
Developer experience
Embed developer experience data from DX within Backstage group pages, helping make your developer portal the go-to hub for developers and teams.
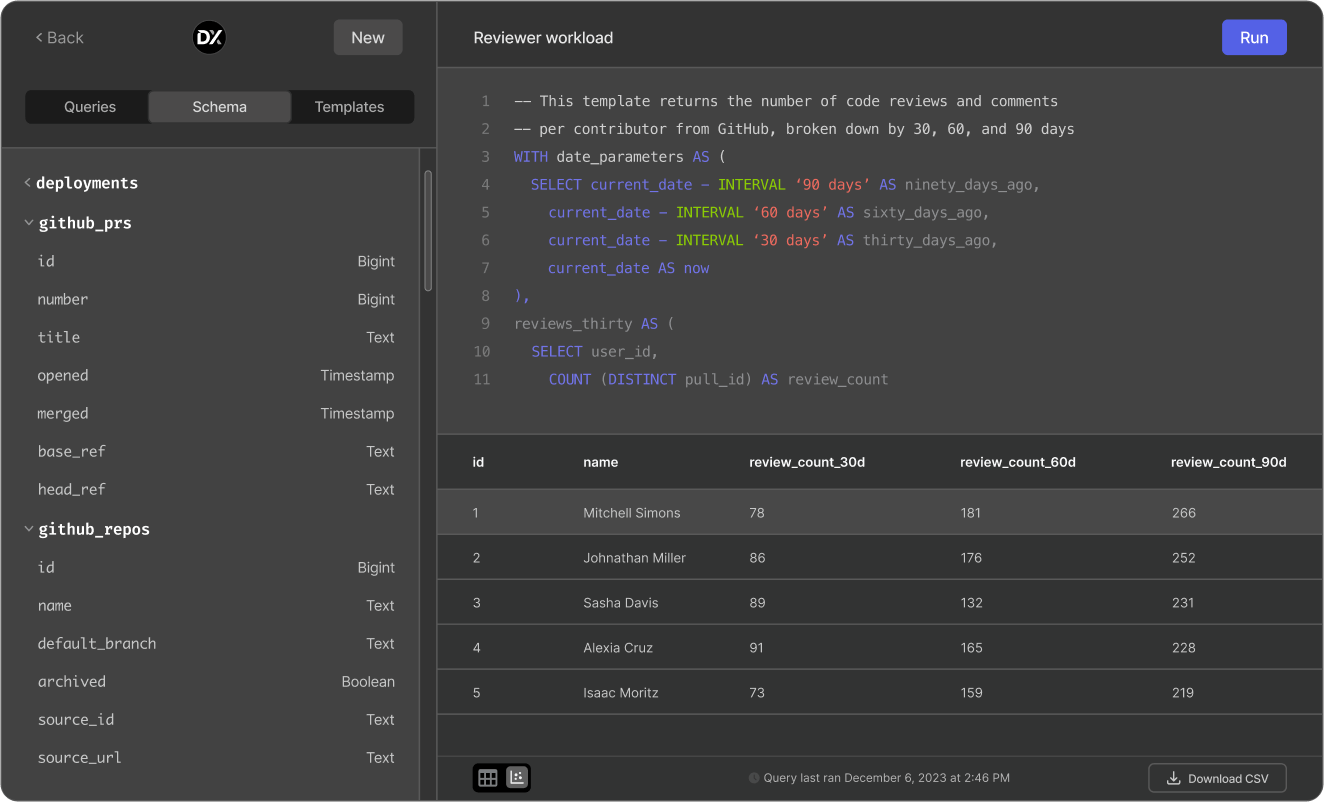
Flexible building blocks
Leverage the DX back-end schema from within Backstage, allowing you to build custom metrics and insights to power scorecards and reporting.
Additional information
DX
Enhance your Backstage instance with DORA metrics, developer experience scores, service insights, and more