How we measure Backstage success at Spotify
- Author
- Helen Greul, Spotify
- Published

Within the Backstage community, much of the conversation centers on strategies for adopting a developer portal. But, we believe it’s equally important to discuss what to do once you’ve made the decision to adopt Backstage. In essence, how can you gauge whether Backstage is moving the needle on improving software development processes? More importantly, how do you measure improvements to developer experience and developer effectiveness?
The answer — like most when it comes to Backstage — is there is no one-size-fits-all approach. So we’ll start with what we know and what we’ve done internally at Spotify. (In our next post, we’ll look at how our friends at Expedia Group go about it.)
Productivity vs efficiency vs effectiveness
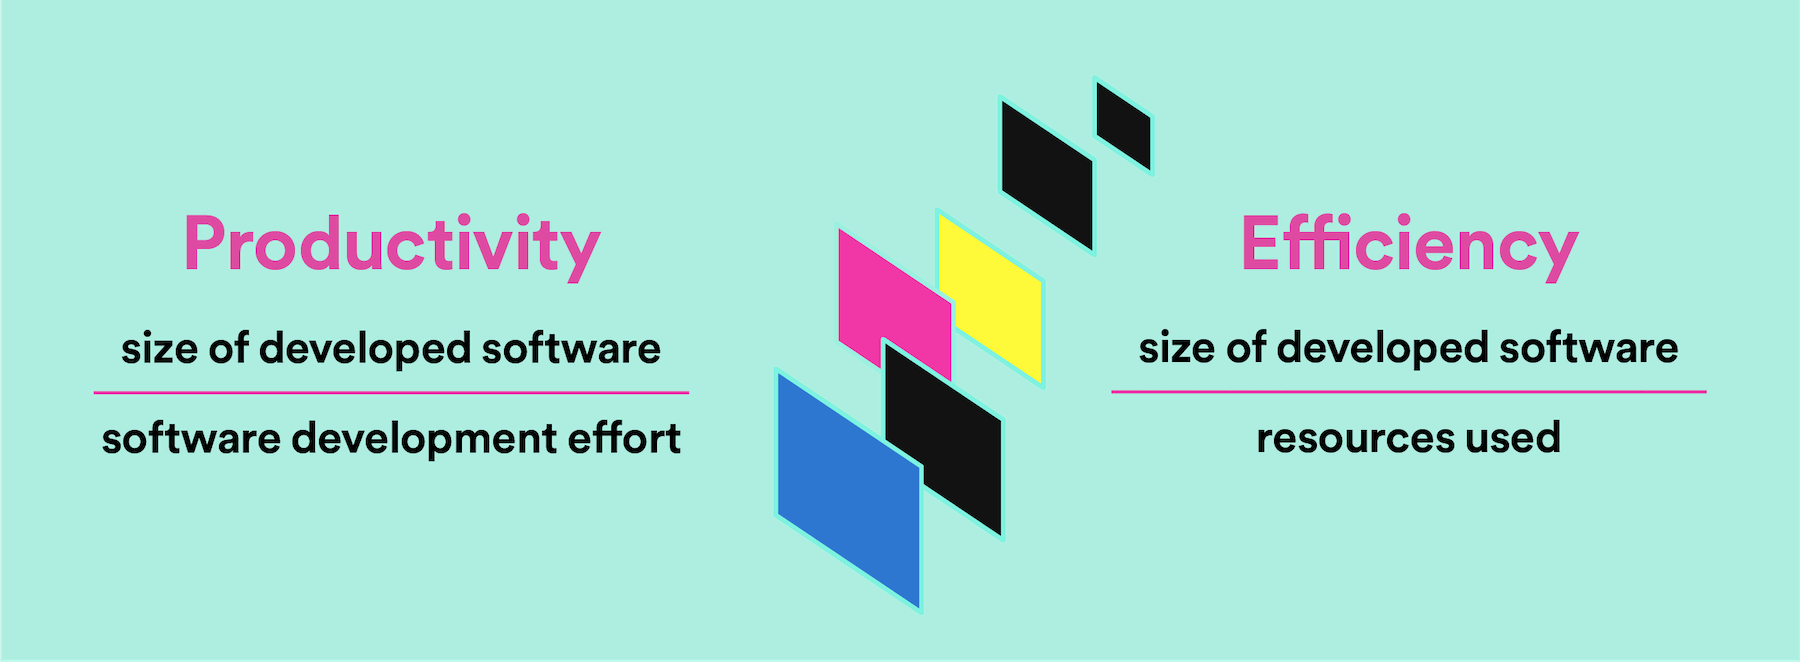
Let’s start with terminology. This may seem pretty basic, but software development is a human-intensive process. Much of its success hinges on a developer’s productivity and efficiency. These terms are often used interchangeably but they are actually different metrics:
- Developer productivity is the ratio of output (i.e., the quantity of work completed) to input (i.e. effort, time). This metric is easy to measure, but it doesn’t tell the whole story.
- Developer efficiency is measured by the amount of resources (i.e., time, computation power, human resources) used per unit of best possible output. It accounts for all the input required, so you can see if the team is doing enough of the right kind of work.
So which one do you need to track in order to determine if your development processes have improved? The answer is both, since productivity focuses on quantity and efficiency focuses on quality. You want a high quantity of output that works as intended or better.
Developer effectiveness
At Spotify, we also hinge a lot of our success on a third metric: developer effectiveness. If building and shipping code is a human-intensive process, effectiveness measures productivity and efficiency but also takes a qualitative look at the human beings in your org. Do people feel empowered to do their best work? Is their energy being applied in healthy ways to both their own goals and the company’s goals? Is it easy to innovate, experiment, and try new things? Effectiveness evaluates important contexts that allow your organization to address low morale, stress/burnout, and other factors that can contribute to poorer quality and high turnover in the long term.
How we approach metrics
So how do we measure productivity, efficiency, and effectiveness, along with other indicators that can tell you about the quality of the overall developer experience?
Time-to-10th PR
Before we built Backstage in 2016, Spotify was in a hyper-growth period and hiring engineers at a breakneck pace. But when we took a look at metrics, we saw our productivity wasn’t getting better, despite all the new hires. Specifically, when we looked at our onboarding metric — which we measure as time-to-merge your 10th pull request — we saw it had ballooned to 60 days.
As we built Backstage, our north star metric was reducing that onboarding time. And it fell quickly to less than 20 days for a new joiner to merge their 10th PR. Even though you may not be onboarding new engineers as rapidly as we were, this metric is a great proxy for the overall complexity of your ecosystem. And reducing it benefits your whole engineering organization, since longtime team members don’t get tapped on the shoulder as often.
Proxy metrics
We also focus on a few other important proxy metrics for our internal version of Backstage, ranging from feedback from our quarterly developer surveys to more traditional metrics, like daily active users.
| Metric | Description |
|---|---|
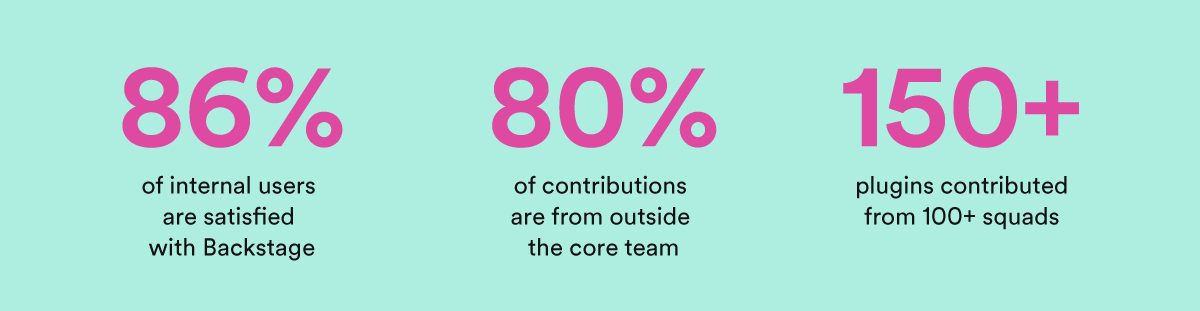
| What our developers are saying | Every quarter we receive feedback through EngSat — Spotify’s official engineering satisfaction survey. |
| Plugin contributions | We look at the total number of plugins developed, how many plugin contributions are coming from teams outside the core Backstage team, and the total number of teams that have contributed at least one plugin. |
| Ease of discovery | Or, in other words, an individual contributor’s ability to go from being stuck to unstuck in just a few minutes. We find that it's extremely important for a growing engineering org to maintain a shared knowledge base that’s easy to navigate and explore with the help of Search. At Spotify, we use metrics like search success rates, click-through rates, and search results relevance. |
| Reduced context switching | Reducing context switching can help engineers stay in the "zone". We measure the number of different tools an engineer has to interact with in order to get a certain job done (i.e. push a change, follow it into production and validate it did not break anything). |
| Traditional metrics | These metrics include visits (monthly active users, daily active users, etc.) and page views. Most Spotify engineers visit Backstage on a daily basis. |
More metrics to consider
Below you’ll find a list of other metrics that you can use to verify if Backstage has a successful impact on your software development process.
| Metric | Description |
|---|---|
| Number of merges per developer/day | Less time spent jumping between different tools and looking for information means more time to focus on shipping code. A second level of bottlenecks can be identified if you categorize contributions by domain (services, web, data, etc). |
| Deploys to production | A close cousin to the metric above. How many times does an engineer push changes into production? |
| MTTR | With clear ownership of all the pieces in your microservices ecosystem and all tools integrated into one place, Backstage makes it quicker for teams to find the root cause of failures and fix them. |
| T-shapedness | A T-shaped engineer is someone who is able to contribute to different domains of engineering. Teams with T-shaped people have fewer bottlenecks and can therefore deliver more consistently. Backstage makes it easier to be T-shaped since tools and infrastructure are consistent between domains, and information is available centrally. |
| Fragmentation | Software Templates help drive standardization in your software ecosystem. By measuring the variance in technology between different software components, it's possible to get a sense of the overall fragmentation in your ecosystem. Examples could include: framework versions, languages, deployment methods and various code quality measurements. |
YMMV: Your metrics may vary
There is no universal answer on how to measure Backstage success, but we believe that a healthy mix of qualitative and quantitative metrics mapped to your organization’s goals are key to that evaluation. We’re excited to hear more from our friends at Expedia on how they’re approaching proof-of-value as they roll out Backstage.